IV.
The Plastic Cycle
Rose Aceves
Chloe Gao
Dakota Harris
Miya Khoo
Step into
our interactive exploration, where we unravel the intricate journey of plastics
from inception to their profound consequences on the environment and human
health. This project navigates the multifaceted Plastic Cycle, uncovering its
pivotal stages—Industry, Production, Transport, Usage, Access, Environmental
Equity, and Disposal. Each stage plays a crucial role in shaping our modern
relationship with this ubiquitous material.
Merging artistic visuals and informative content, our virtual tour provides a comprehensive understanding of the Plastic Cycle. From delving into archival data to utilizing spatial mapping, this project encourages you to unearth intricate details and reflect on the broader implications of our connection with plastics, society, and the environment. As you traverse this endless piece of paper, not only do we offer a written narrative, but we also provide a spatial context. We hope this map becomes a tool for readers to comprehend the spatial dimensions of the plastic cycle, offering insights into its scope and impact on both the local and global scale.


Stage 1: Industry, Production, Transport
The initial stage in the plastic cycle revolves around the production and manufacturing of plastics. This stage begins with the extraction of raw materials, typically fossil fuels such as oil and natural gas, which serve as the primary feedstocks for plastic production. Globally, over 368 million metric tons of plastic were produced in 2019, with the United States alone contributing approximately 42 million metric tons annually. The extraction and processing of these raw materials not only deplete finite resources but also contribute significantly to environmental impacts, including habitat disruption and greenhouse gas emissions.
Once the raw materials are obtained, they undergo a series of energy-intensive chemical processes, including polymerization, to create the polymers that form the basis of plastic. The manufacturing process involves shaping the polymers into specific forms, such as pellets, sheets, or fibers, which can be further processed into a wide range of plastic products. The energy expended in the manufacturing of plastics accounts for about 6% of the world’s total oil consumption, underscoring the environmental impact associated with the energy demands of the plastic production process.
Moreover, the manufacturing of plastics is a significant contributor to environmental pollution and climate change. Plastic production facilities globally release substantial amounts of greenhouse gasses, including carbon dioxide and methane, into the atmosphere. To put this into perspective, the production of one ton of plastic is estimated to result in approximately 6 tons of carbon dioxide emissions. Additionally, volatile organic compounds (VOCs) and other pollutants released during plastic manufacturing contribute to air pollution, affecting both local air quality and global climate patterns. Efforts to address these emissions include the adoption of cleaner production technologies, increased energy efficiency, and regulatory measures to limit environmental impact.
The collage serves as a visual synthesis, encapsulating the impacts and processes involved in the industrial manufacturing and transportation of plastics. At its core, the collage features a map delineating Chicago’s Cook County, strategically layered with 2023 census tracts, major roads, highways, and waterways. Highlighted in red, certain census tracts are identified as socioeconomically disadvantaged by the city of Chicago, determined through metrics from the American Community Survey, including household income, poverty rate, and unemployment rate. Additionally, gray regions on the map signify the city's designated industrial corridors. The collage further incorporates point data, vividly portraying plastics production facilities in purple, sites of Toxic Chemical Release from plastics/rubber manufacturing facilities in yellow (according to EPA data), and instances of plastic pollution reported by citizens (depicted in purple, sourced from Marine Debris Tracker data).


Fast forward to the present, and the storyline seamlessly transitions to the contemporary stage of plastic usage. Everyday scenes unfold—grocery shopping, takeout containers, packaging materials—a tapestry of mundane yet essential moments that showcase the ubiquity of plastic in our lives. What was once a symbol of progress has become an intrinsic part of our daily routines, reflecting its adaptability and versatility.
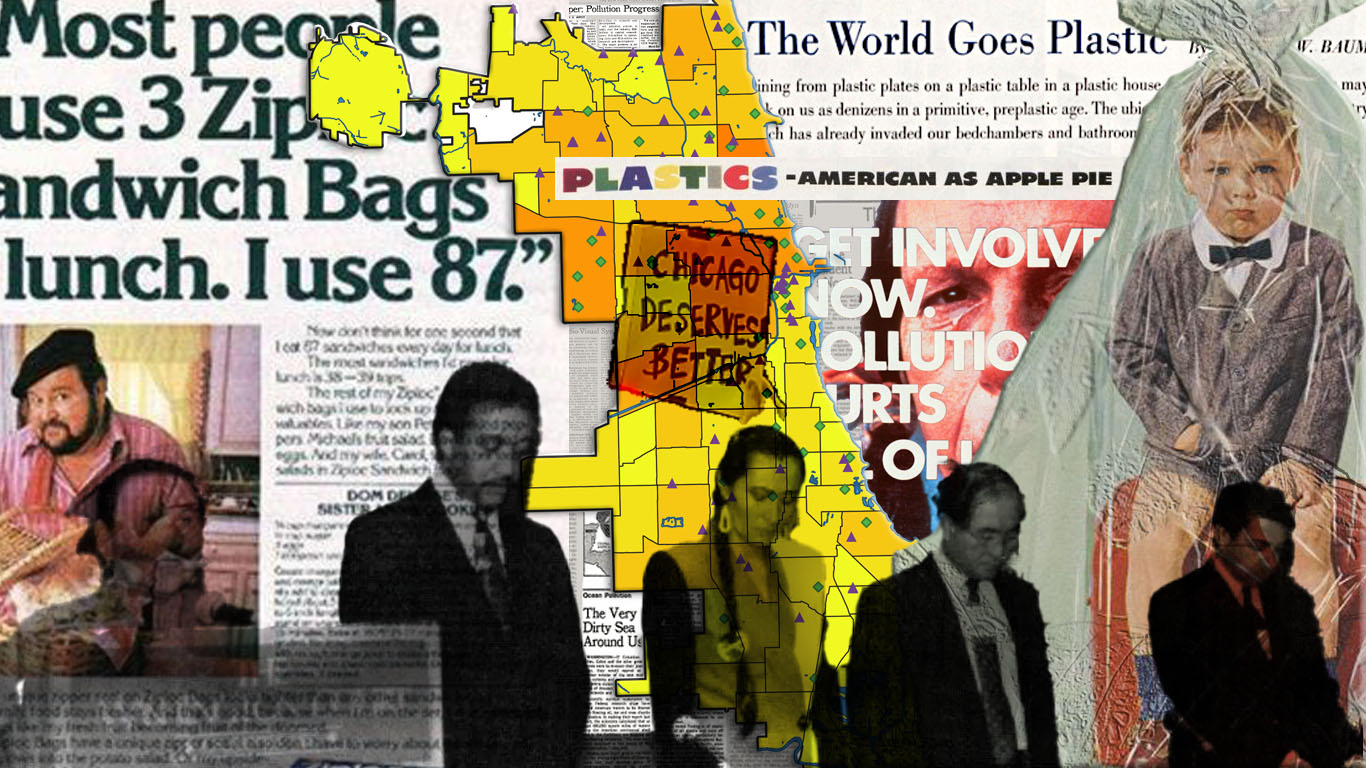
This stage, however, is not merely about convenience. It represents a pivotal chapter in the plastic narrative, marking the point where our individual choices converge with the broader societal and environmental consequences of our reliance on this material. The collage, “11_PlasticCycleStage2_Usage,Access,EJCollageMap,” intricately unveils the dual nature of our daily plastic consumption, starting with the foregrounding of mid-20th-century advertisements that once celebrated the convenience and versatility of plastic. These vintage visuals, artifacts of a bygone era, reflect a time when plastic was championed as a symbol of progress.
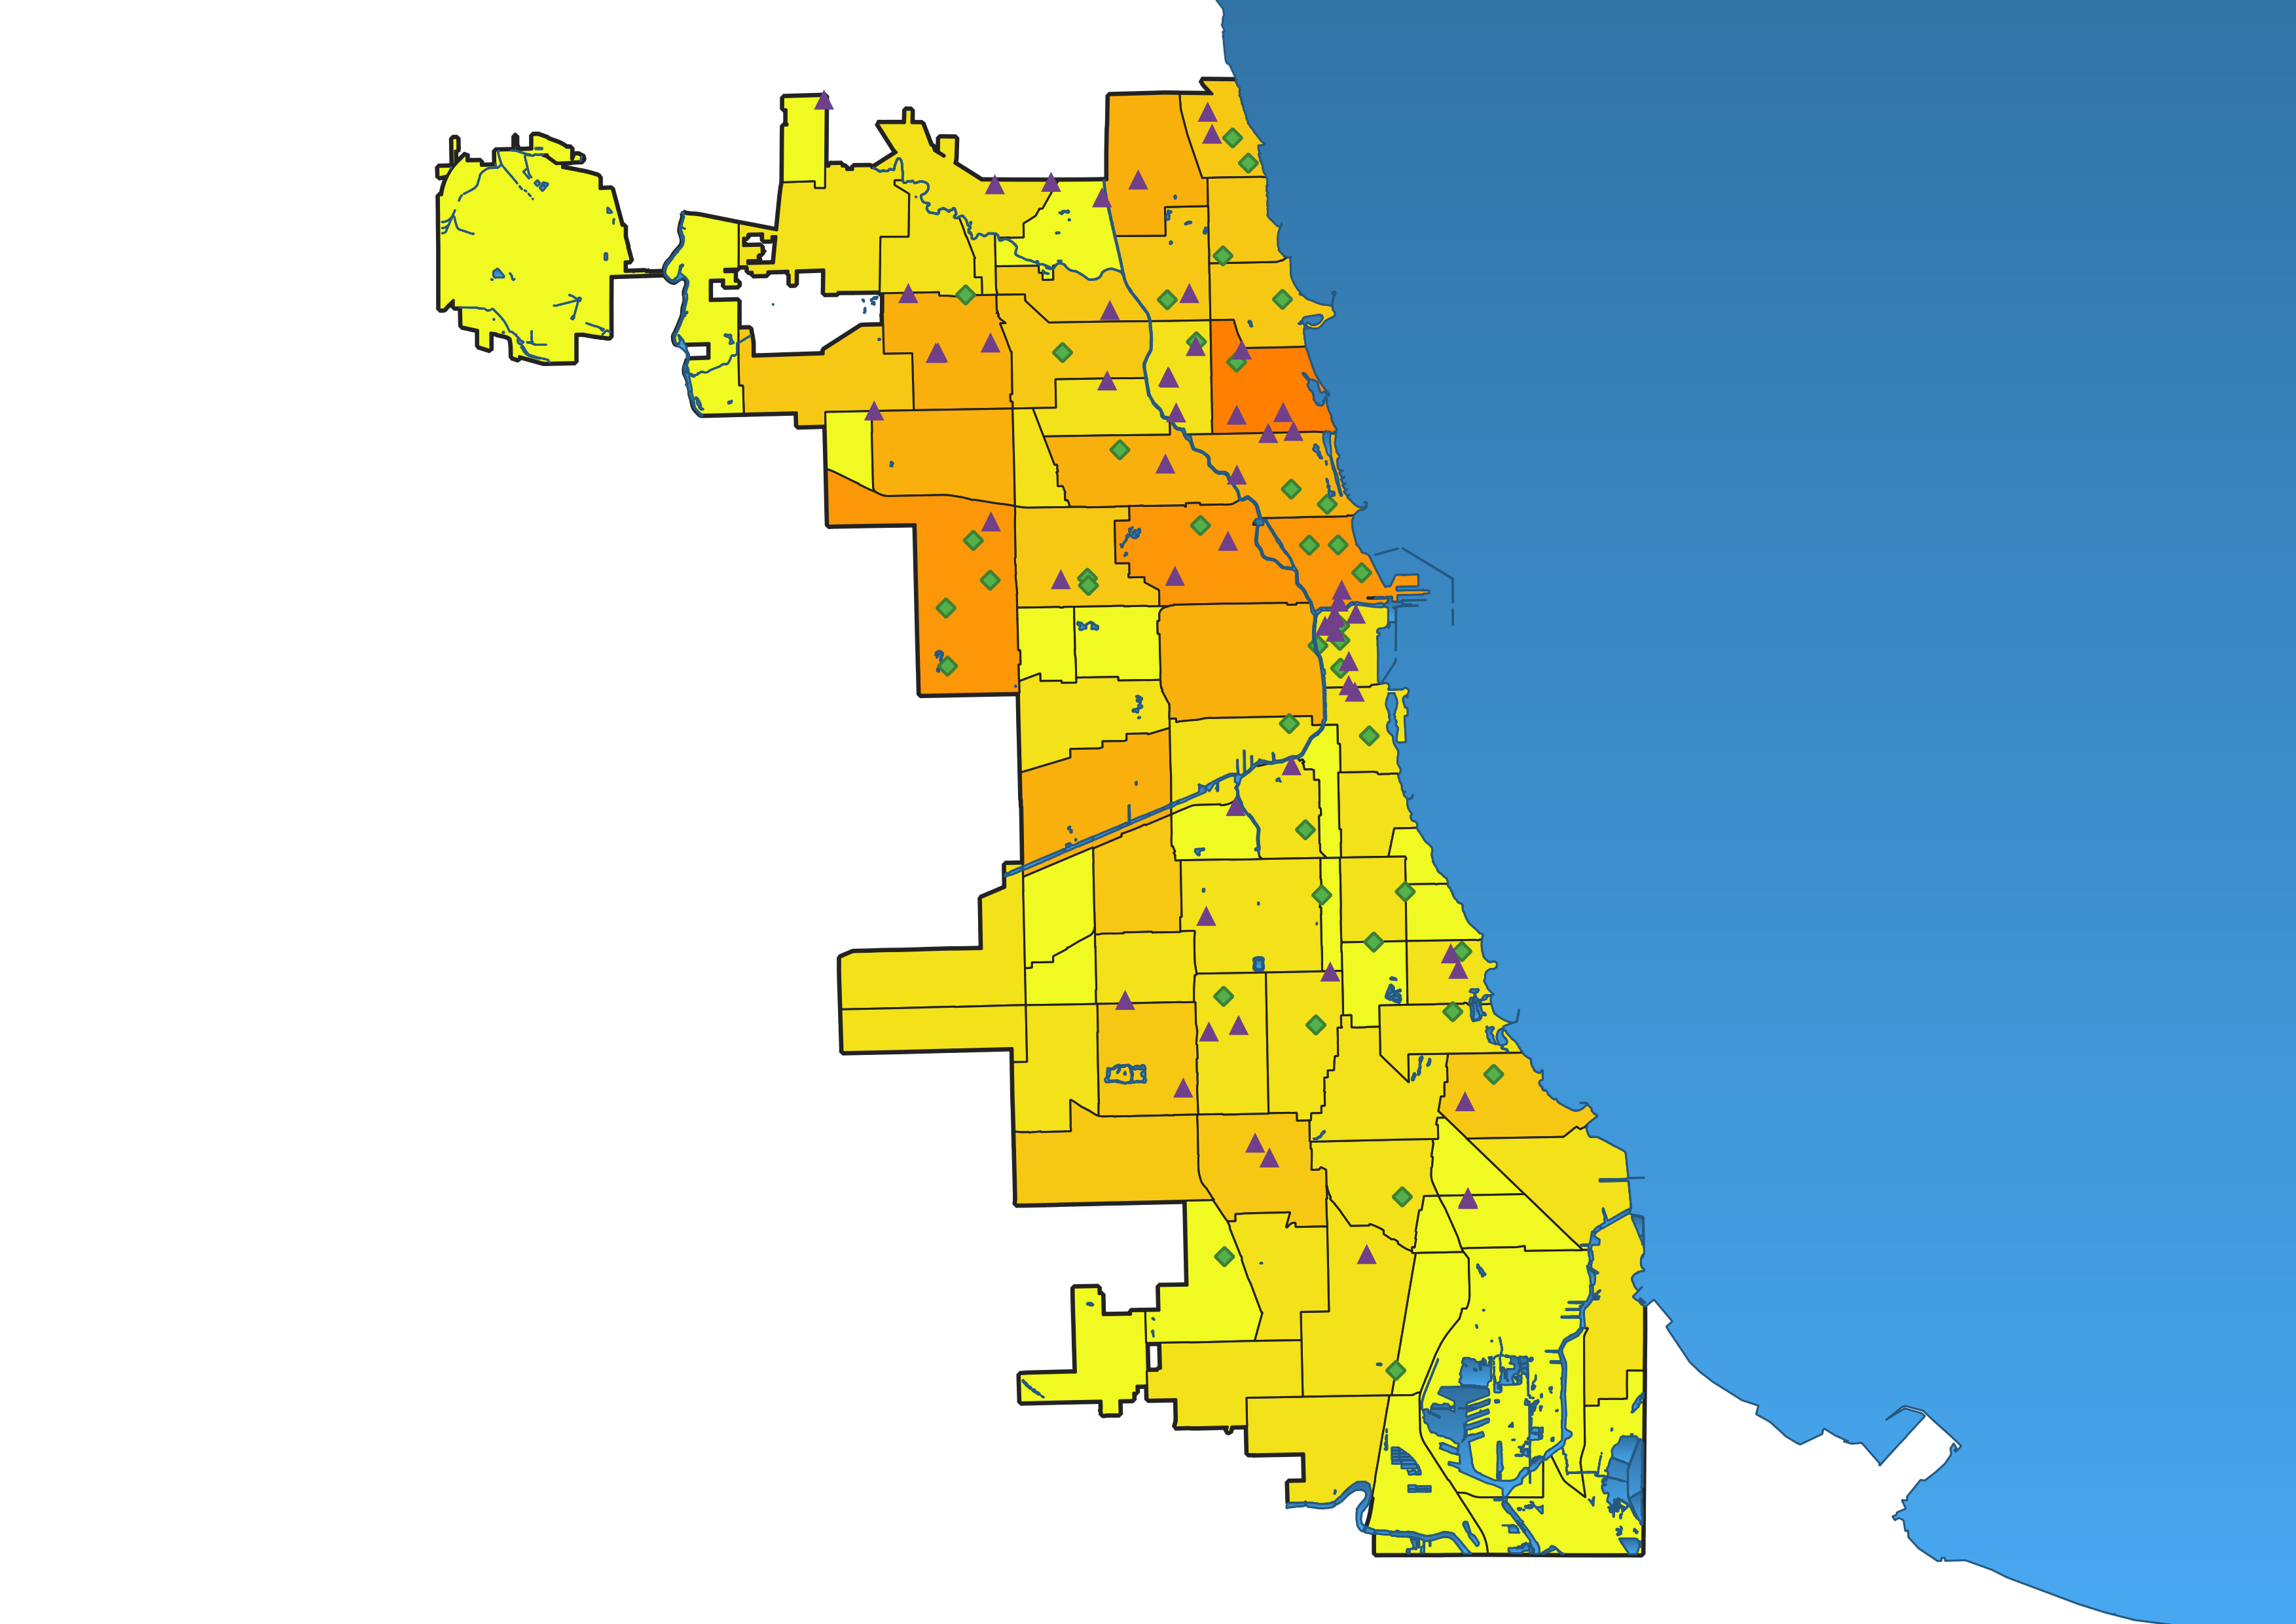
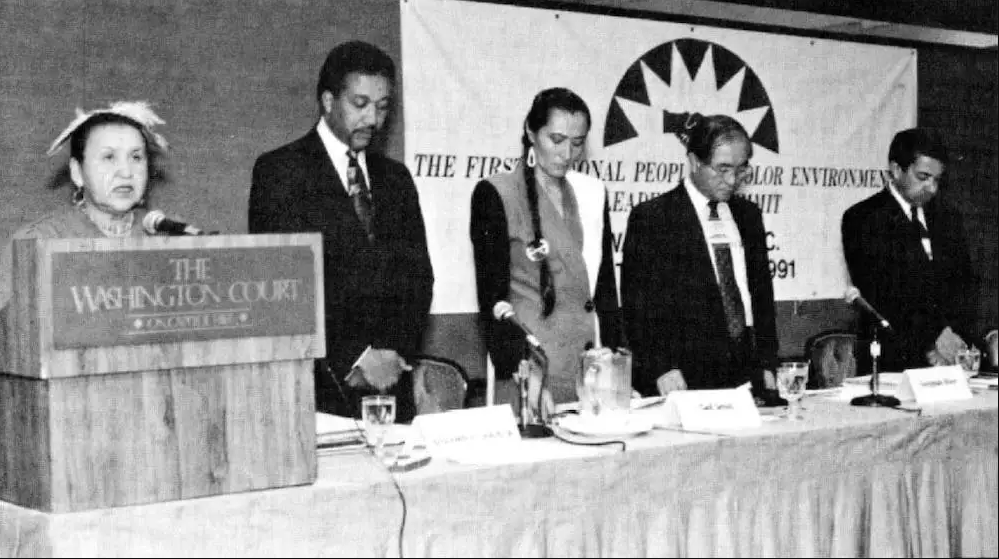
In the context of environmental justice, the collage vividly portrays how this daily cycle perpetuates and exacerbates existing inequalities. An estimated 74,000 to 121,000 microplastic particles are ingested by Americans annually[1]. This figure does not account for the numerous individuals disproportionately affected by this phenomenon. Those with limited access to fresh foods are not only compelled to rely on plastic-laden alternatives but also find themselves disproportionately exposed to the environmental consequences of plastic pollution. This inequity is particularly evident in disadvantaged neighborhoods, where the lack of resources converges with heightened vulnerability to the detrimental effects of plastic waste. This is seen in the choropleth map of Chicago’s total population where the purple triangles represent fast locations and the green diamonds represent the fresh food markets. In the midst of this visual narrative, the First National People of Color Environmental Leadership Summit image[2] stands as a rallying point, symbolizing the collective call for equitable environmental solutions. The collage, with its layered storytelling, prompts viewers to confront the implications of their own daily choices and consider the broader ramifications of these actions on both individual well-being and the equitable distribution of environmental burdens. It serves as a visual call to address the intertwined issues of consumption, access, and justice in the pursuit of a more sustainable and equitable future, as well as shedding light to the often-overlooked consequences of the plastic cycle.


After a plastic has been created and used, the plastic is then discarded, giving shape to the third stage of the plastic cycle, plastic disposal. This stage is a critical part of the overall plastic life cycle and significantly influences environmental outcomes. This includes landfills, incineration, open dumping, and ocean dumping.
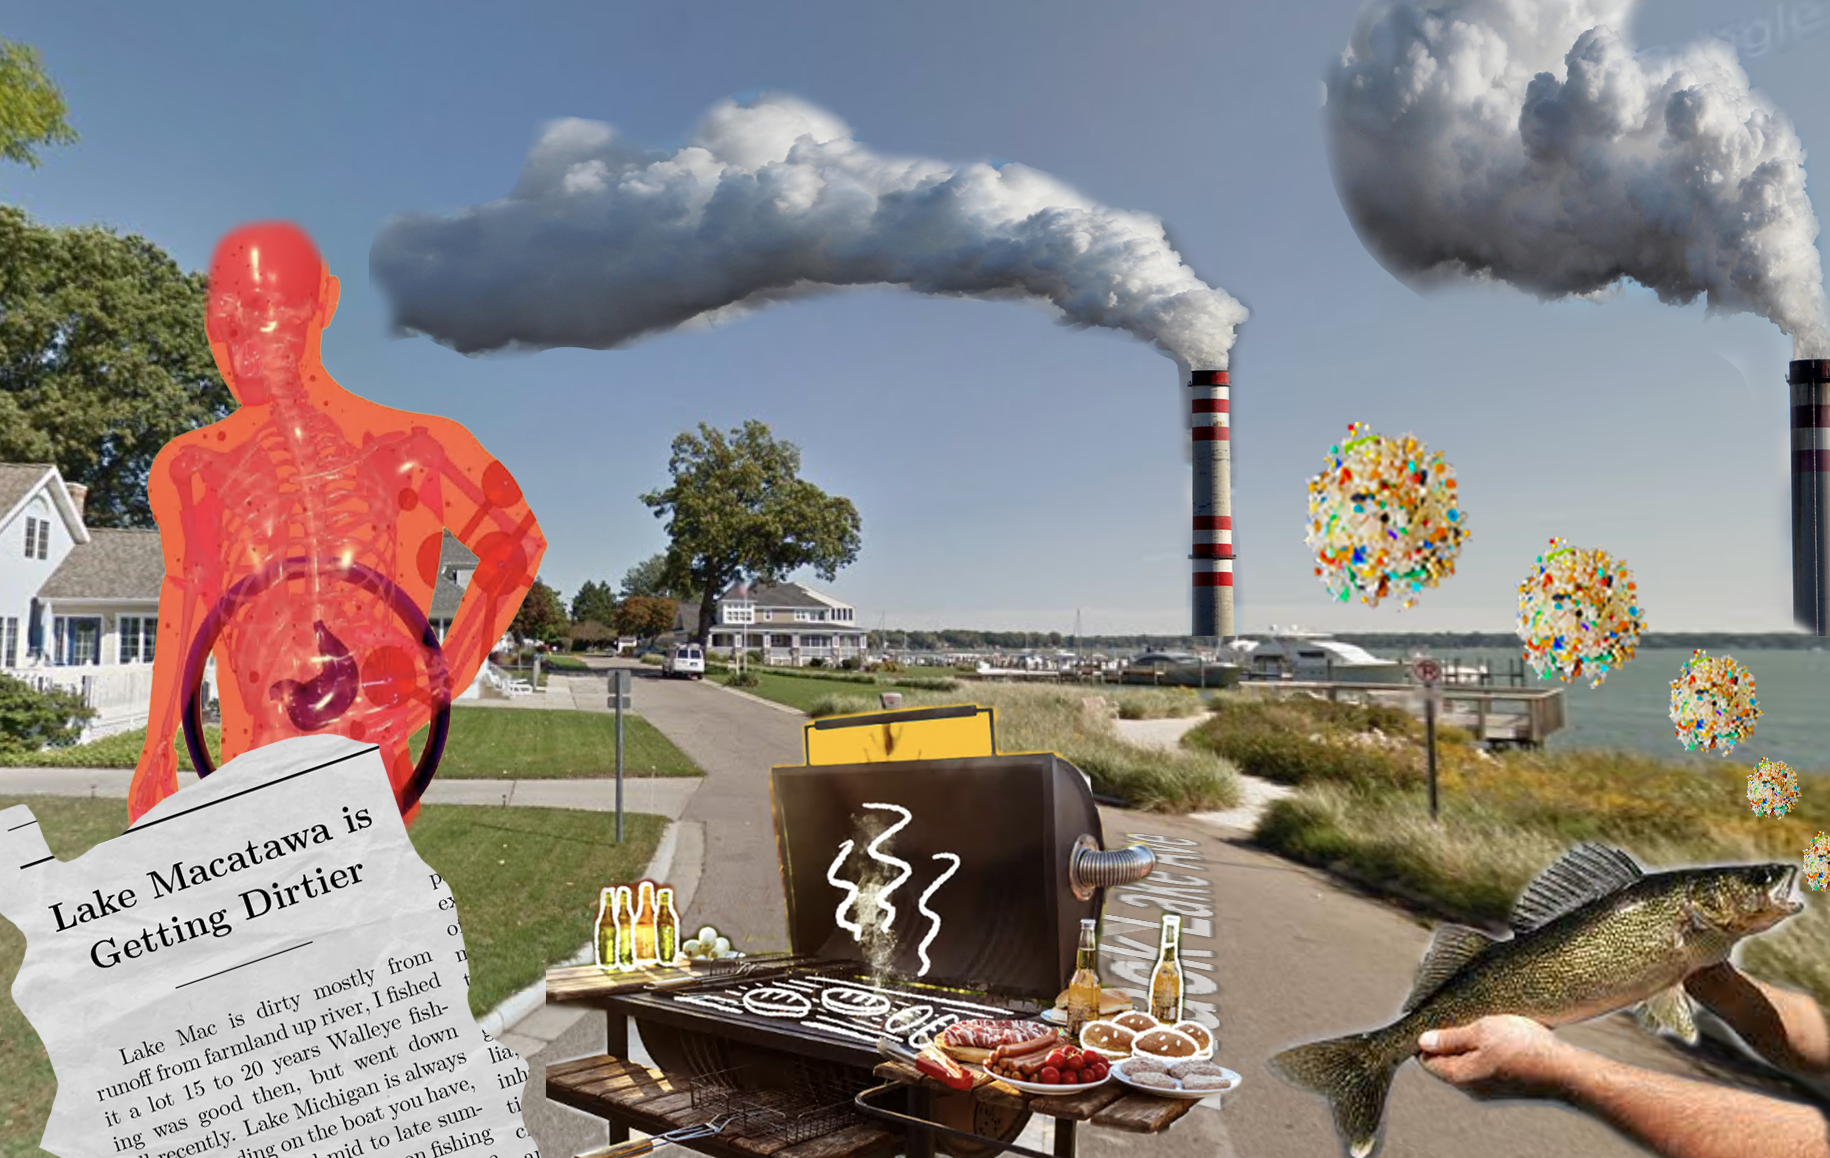
A major source of plastic pollution in the Great Lakes stems from the inadequate management of plastic waste, particularly the disposal practices associated with the landfill industry. Improperly discarded plastics find their way into waterways through runoff and wind transport, eventually reaching the lakes. Once in the Great Lakes, plastics undergo various processes, breaking down into smaller particles known as microplastics. These microplastics pose a severe threat to aquatic organisms, as they are ingested by fish and other wildlife, leading to bioaccumulation within the food chain. Efforts to mitigate this issue involve promoting proper waste disposal, enhancing recycling infrastructure, and advocating for the reduction of single-use plastics to preserve the ecological integrity of the Great Lakes for future generations. Even so, through statistical analysis by the EPA[3]., in the United States, about 75% of plastic waste goes to landfills, 19% is incinerated, 4% is mismanaged, and 4% is recycled. About 0.5% of waste ends up in our waters, averaging about 1 to 2 million tonnes of plastic in our waters.
With a concentration in Chicago, the map provided “Great_Lakes_Plastic_Waste_Map” inspects the greatest landfills in the Chicago area, showing where exactly these factories are located, in respect to land coverage. The Chicago boundaries are far from these locations, for obvious reasons, though, the plastics do not fail to make their way into the great lakes and wash up on the shores, exposing us to the next step of this cycle.


Stage 4: Environmental and Human Effects
The final phase of the analysis scrutinizes the ramifications of plastic waste on ecological systems and human health, with a focus on microplastics. Detected in fish muscle, microplastics pose a direct threat to human food sources, particularly as fish are a key dietary protein[4]. The presence of microplastics in commercial fish species underlines a potential crisis in aquatic food security. One research involving a global analysis of oceanic plastic pollution included data on plastic ingestion for 555 species of marine and estuarine fish, and the findings indicated that 386 species—two-thirds of all surveyed—had ingested plastic, and of these, 210 species are commercially fished.[5]
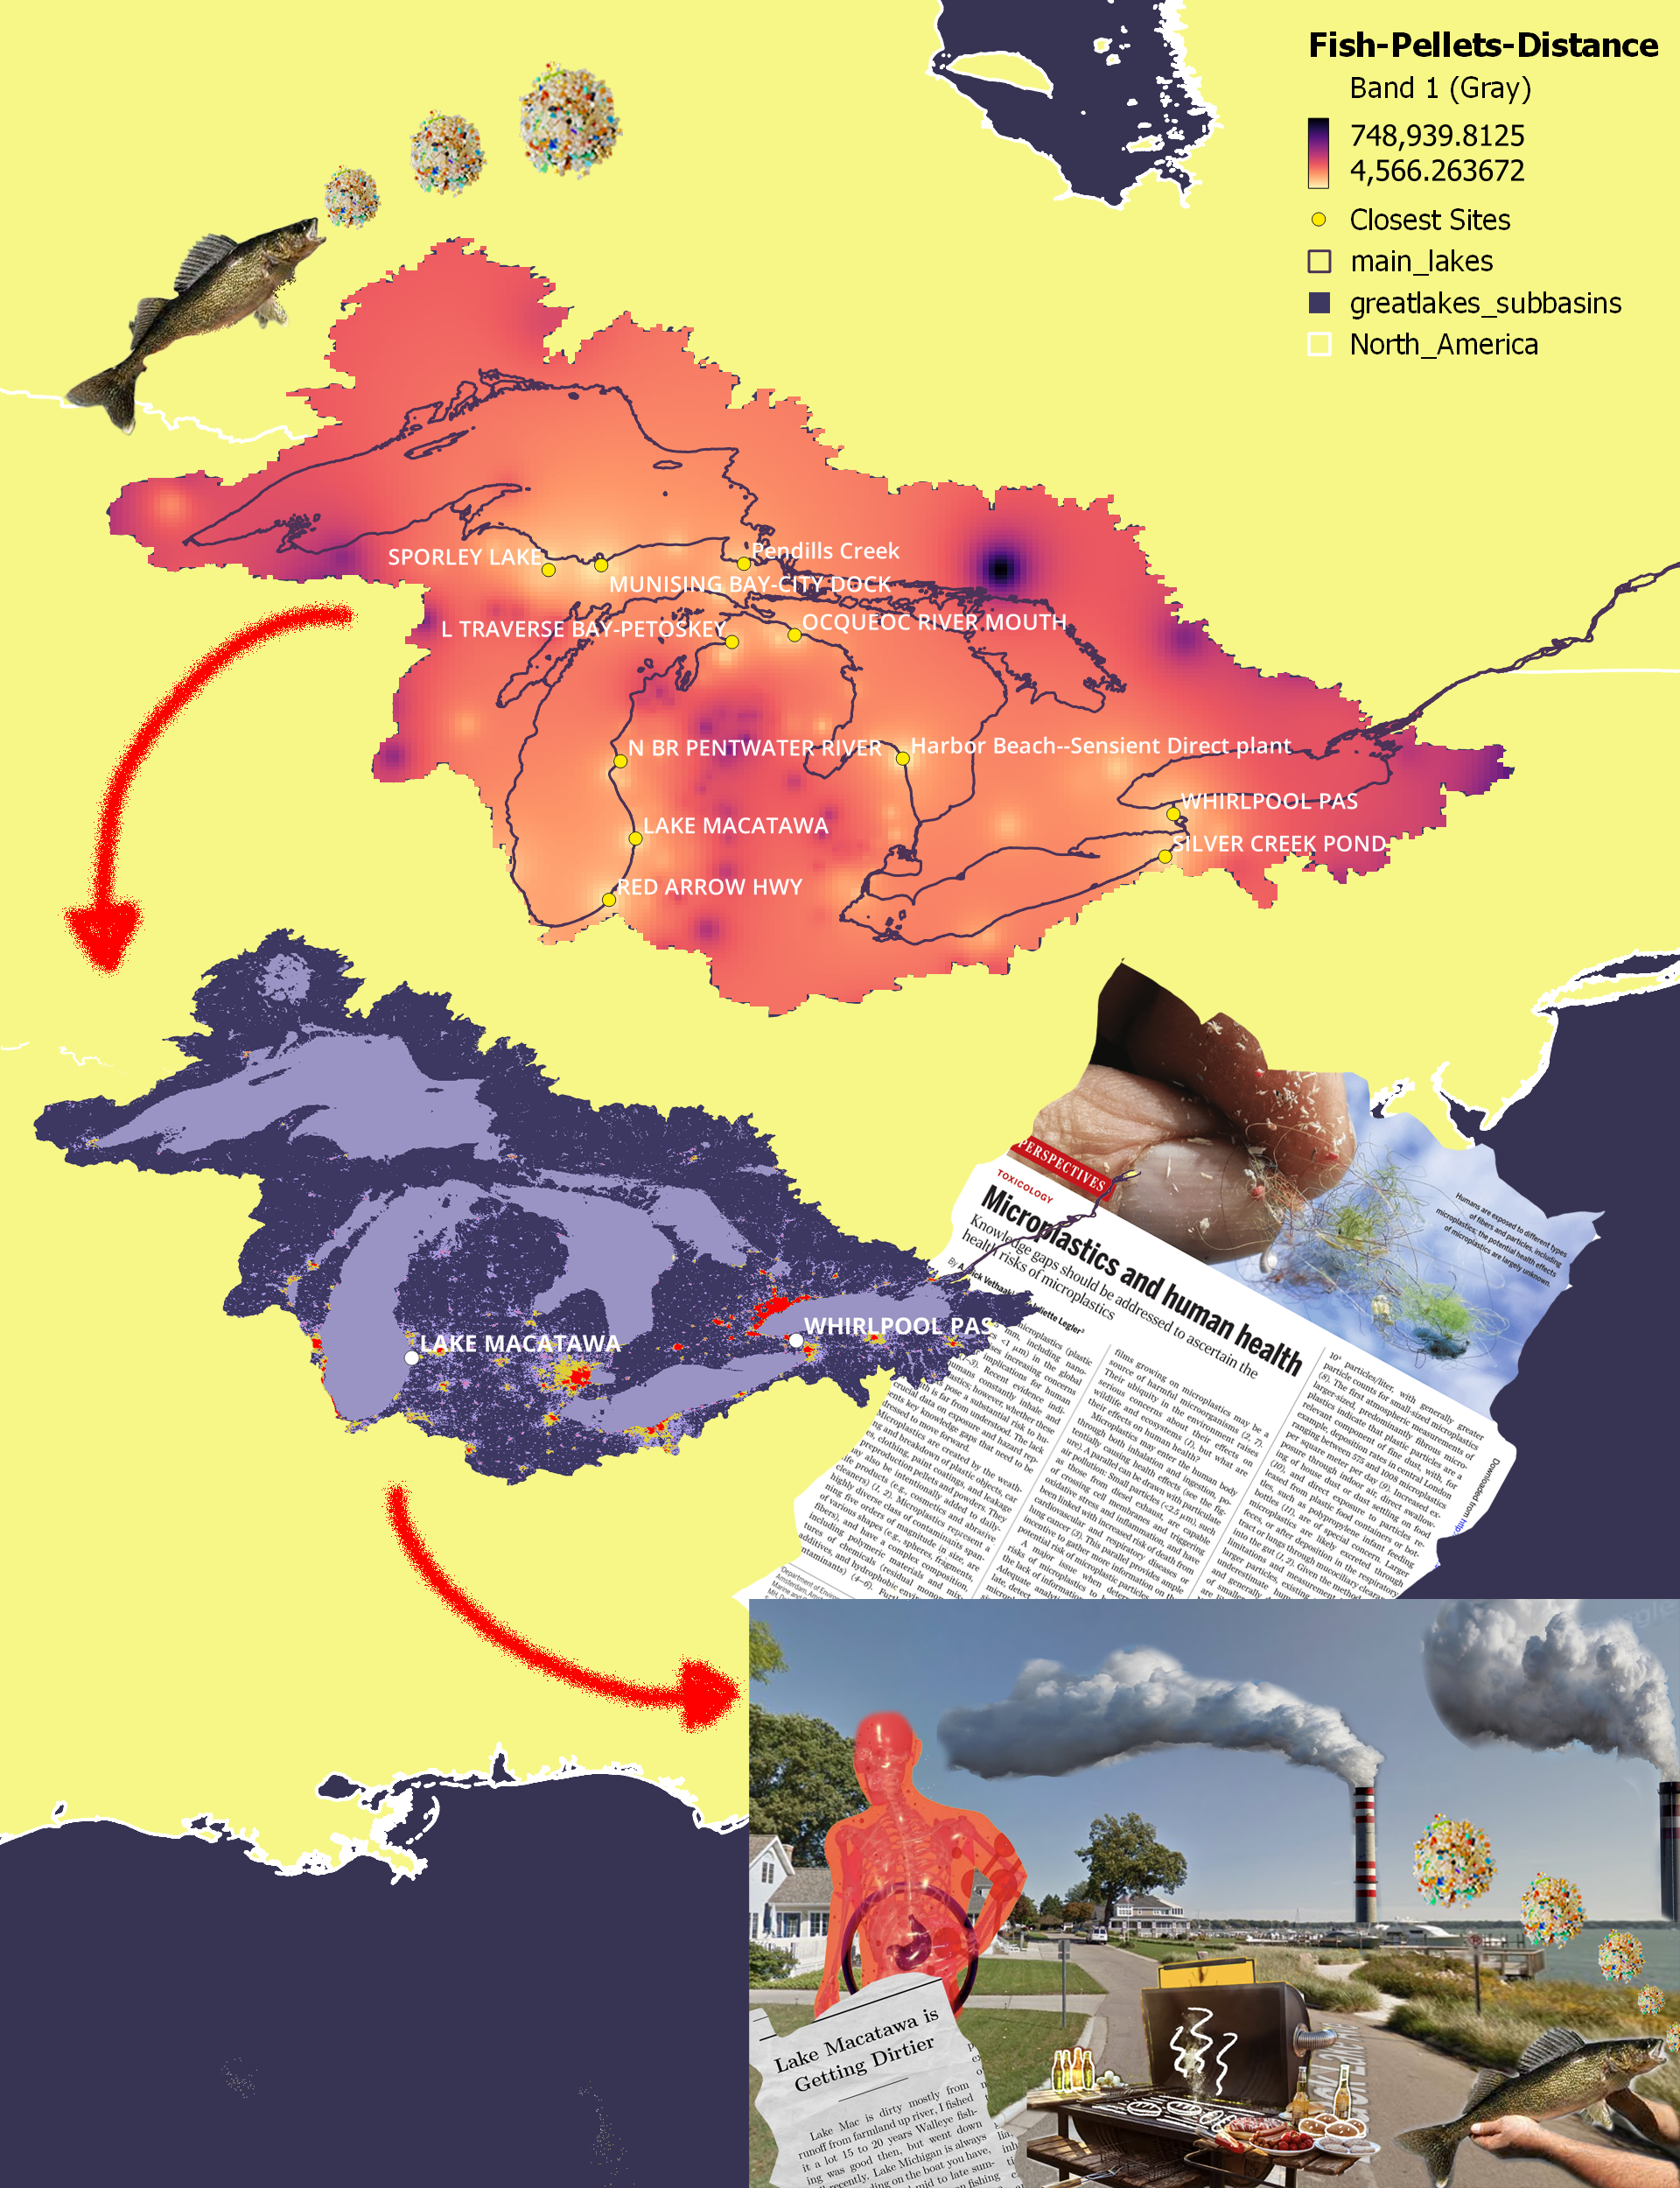
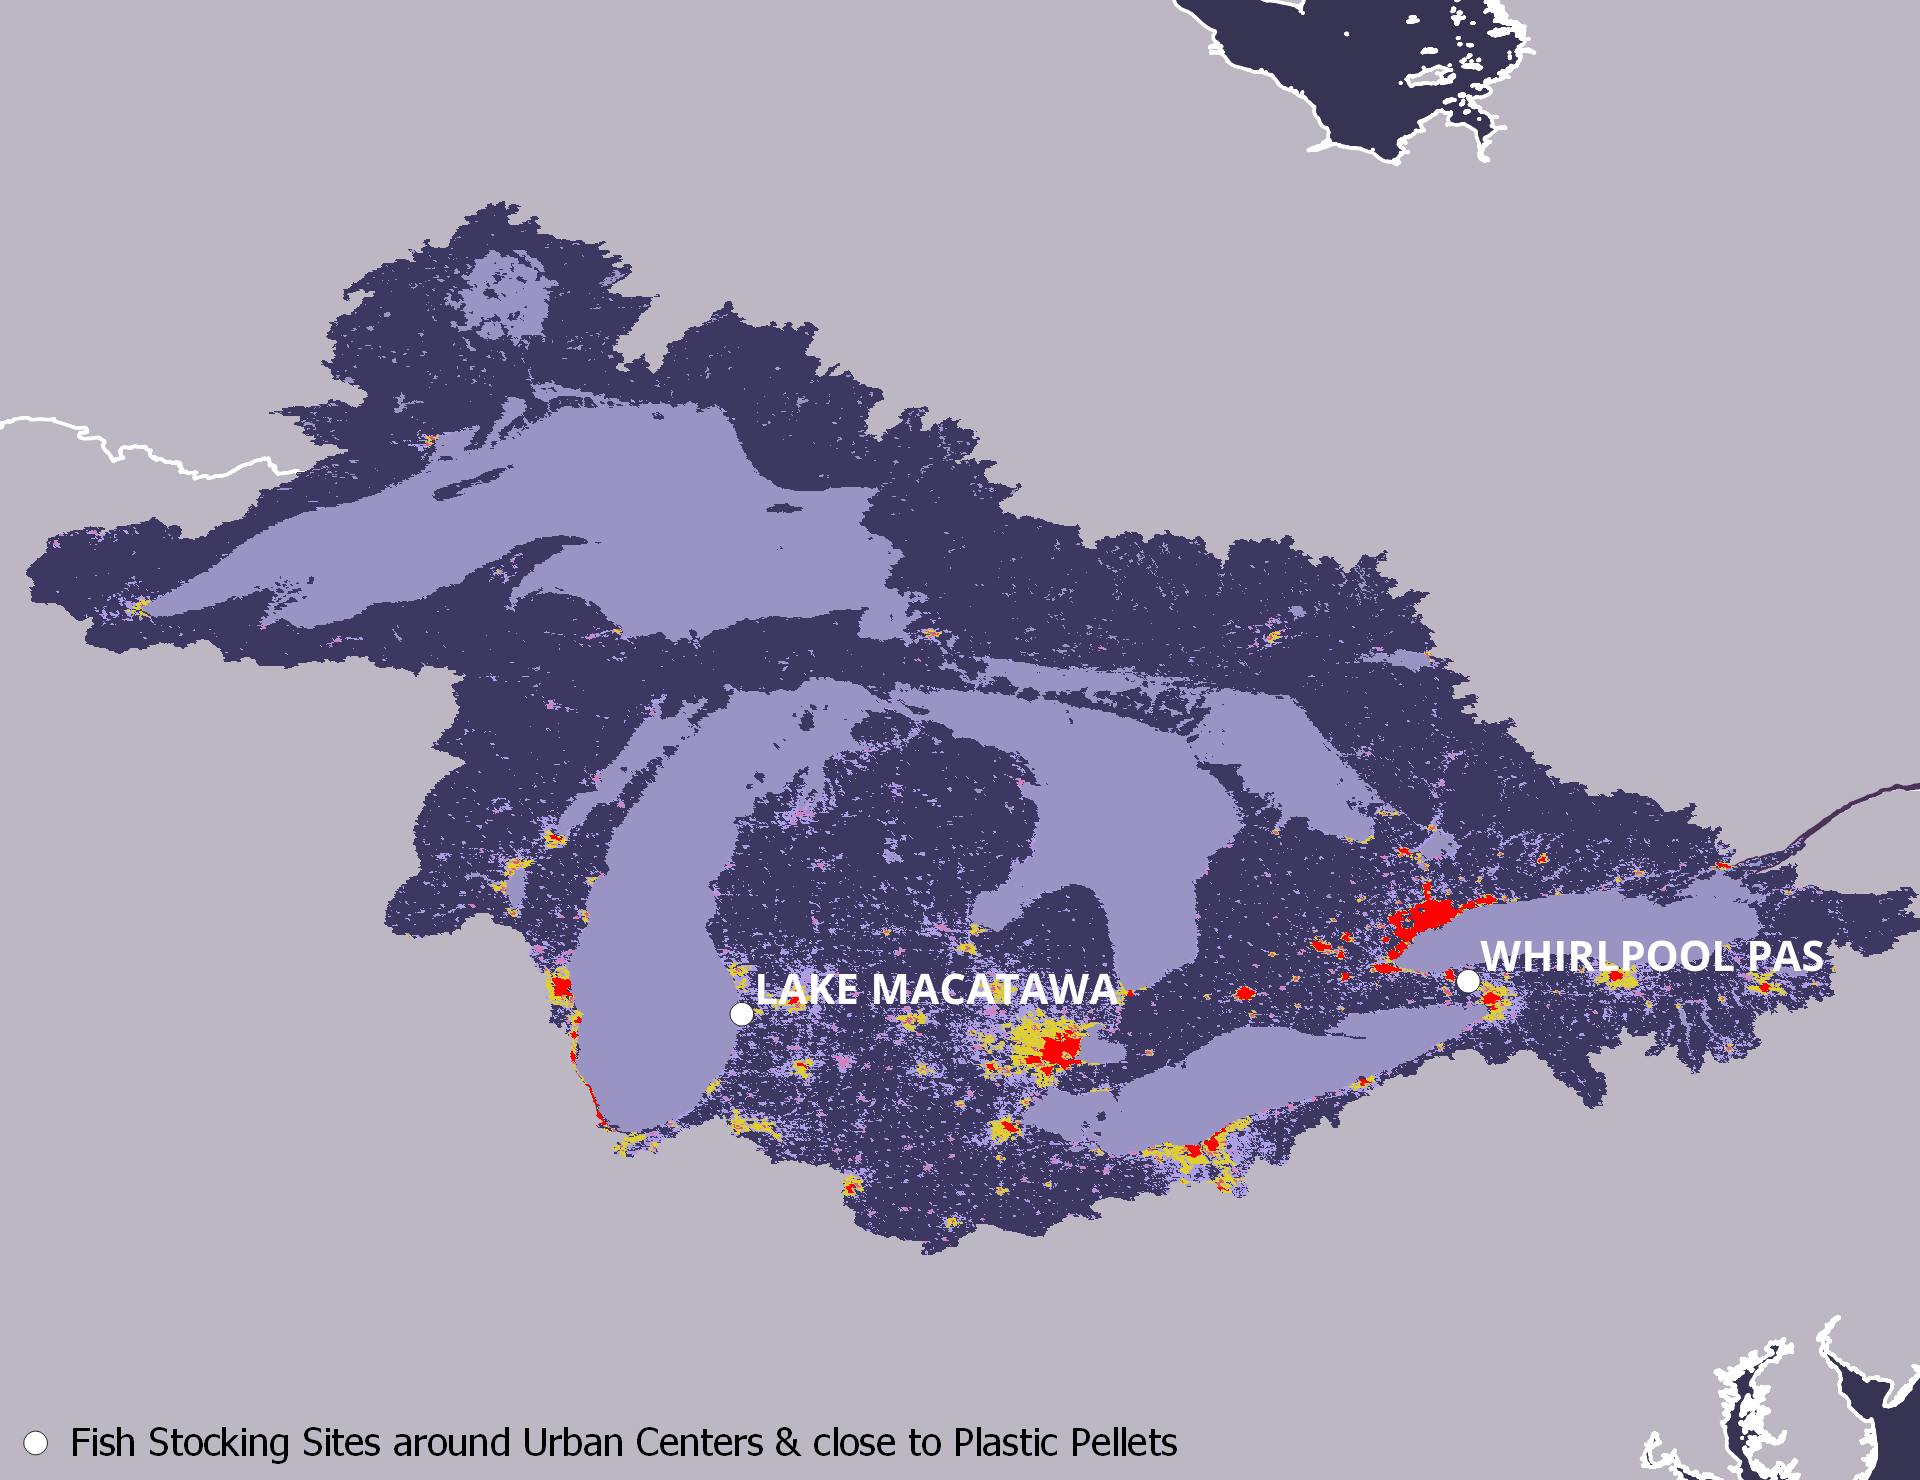
To further investigate the impact of microplastics on both the ecosystem, specifically fish, and human health, two main maps were generated. The first is a visualization of the distance between plastic pellet locations[6] and fish stocking areas[7]. The methodological approach of mapping the proximity between plastic pellet deposits and fish stocking areas illuminates the overlap between potential sources of microplastics and marine habitats. The second identifies fish stocking areas closest to the pellet sites and adjacent to urban centers.
Due to the scarcity of microplastics data, the analysis concentrated on plastic pellets, which often constitute microplastics (up to 5mm). The resulting imagery reveals that a significant proportion of the fish stocking areas are situated near sites where plastic pellets have been found, particularly along shorelines, which is a stark visualization of the potential for contamination in areas critical to both marine life and commercial fishing. The analysis of human health impact involved overlaying a global human settlement layer on the map to determine which of the selected fish stocking areas are near urban centers. This geographical correlation between plastic deposits and fish stocking areas adjacent to urban centers stresses the impact of human activity on marine ecosystems.
Finally, the selection of Lake Macatawa for a detailed case study allows for a localized examination of the interplay between urbanization and plastic pollution. The creation of a collage depicting the life cycle of plastics in an urban setting narratively maps the journey from production and consumption to environmental contamination and human health implications. This visual representation not only summarizes the study's findings but also serves as a powerful tool for communicating the complex dynamics of plastic pollution to a broader audience, potentially influencing public perception and policy.
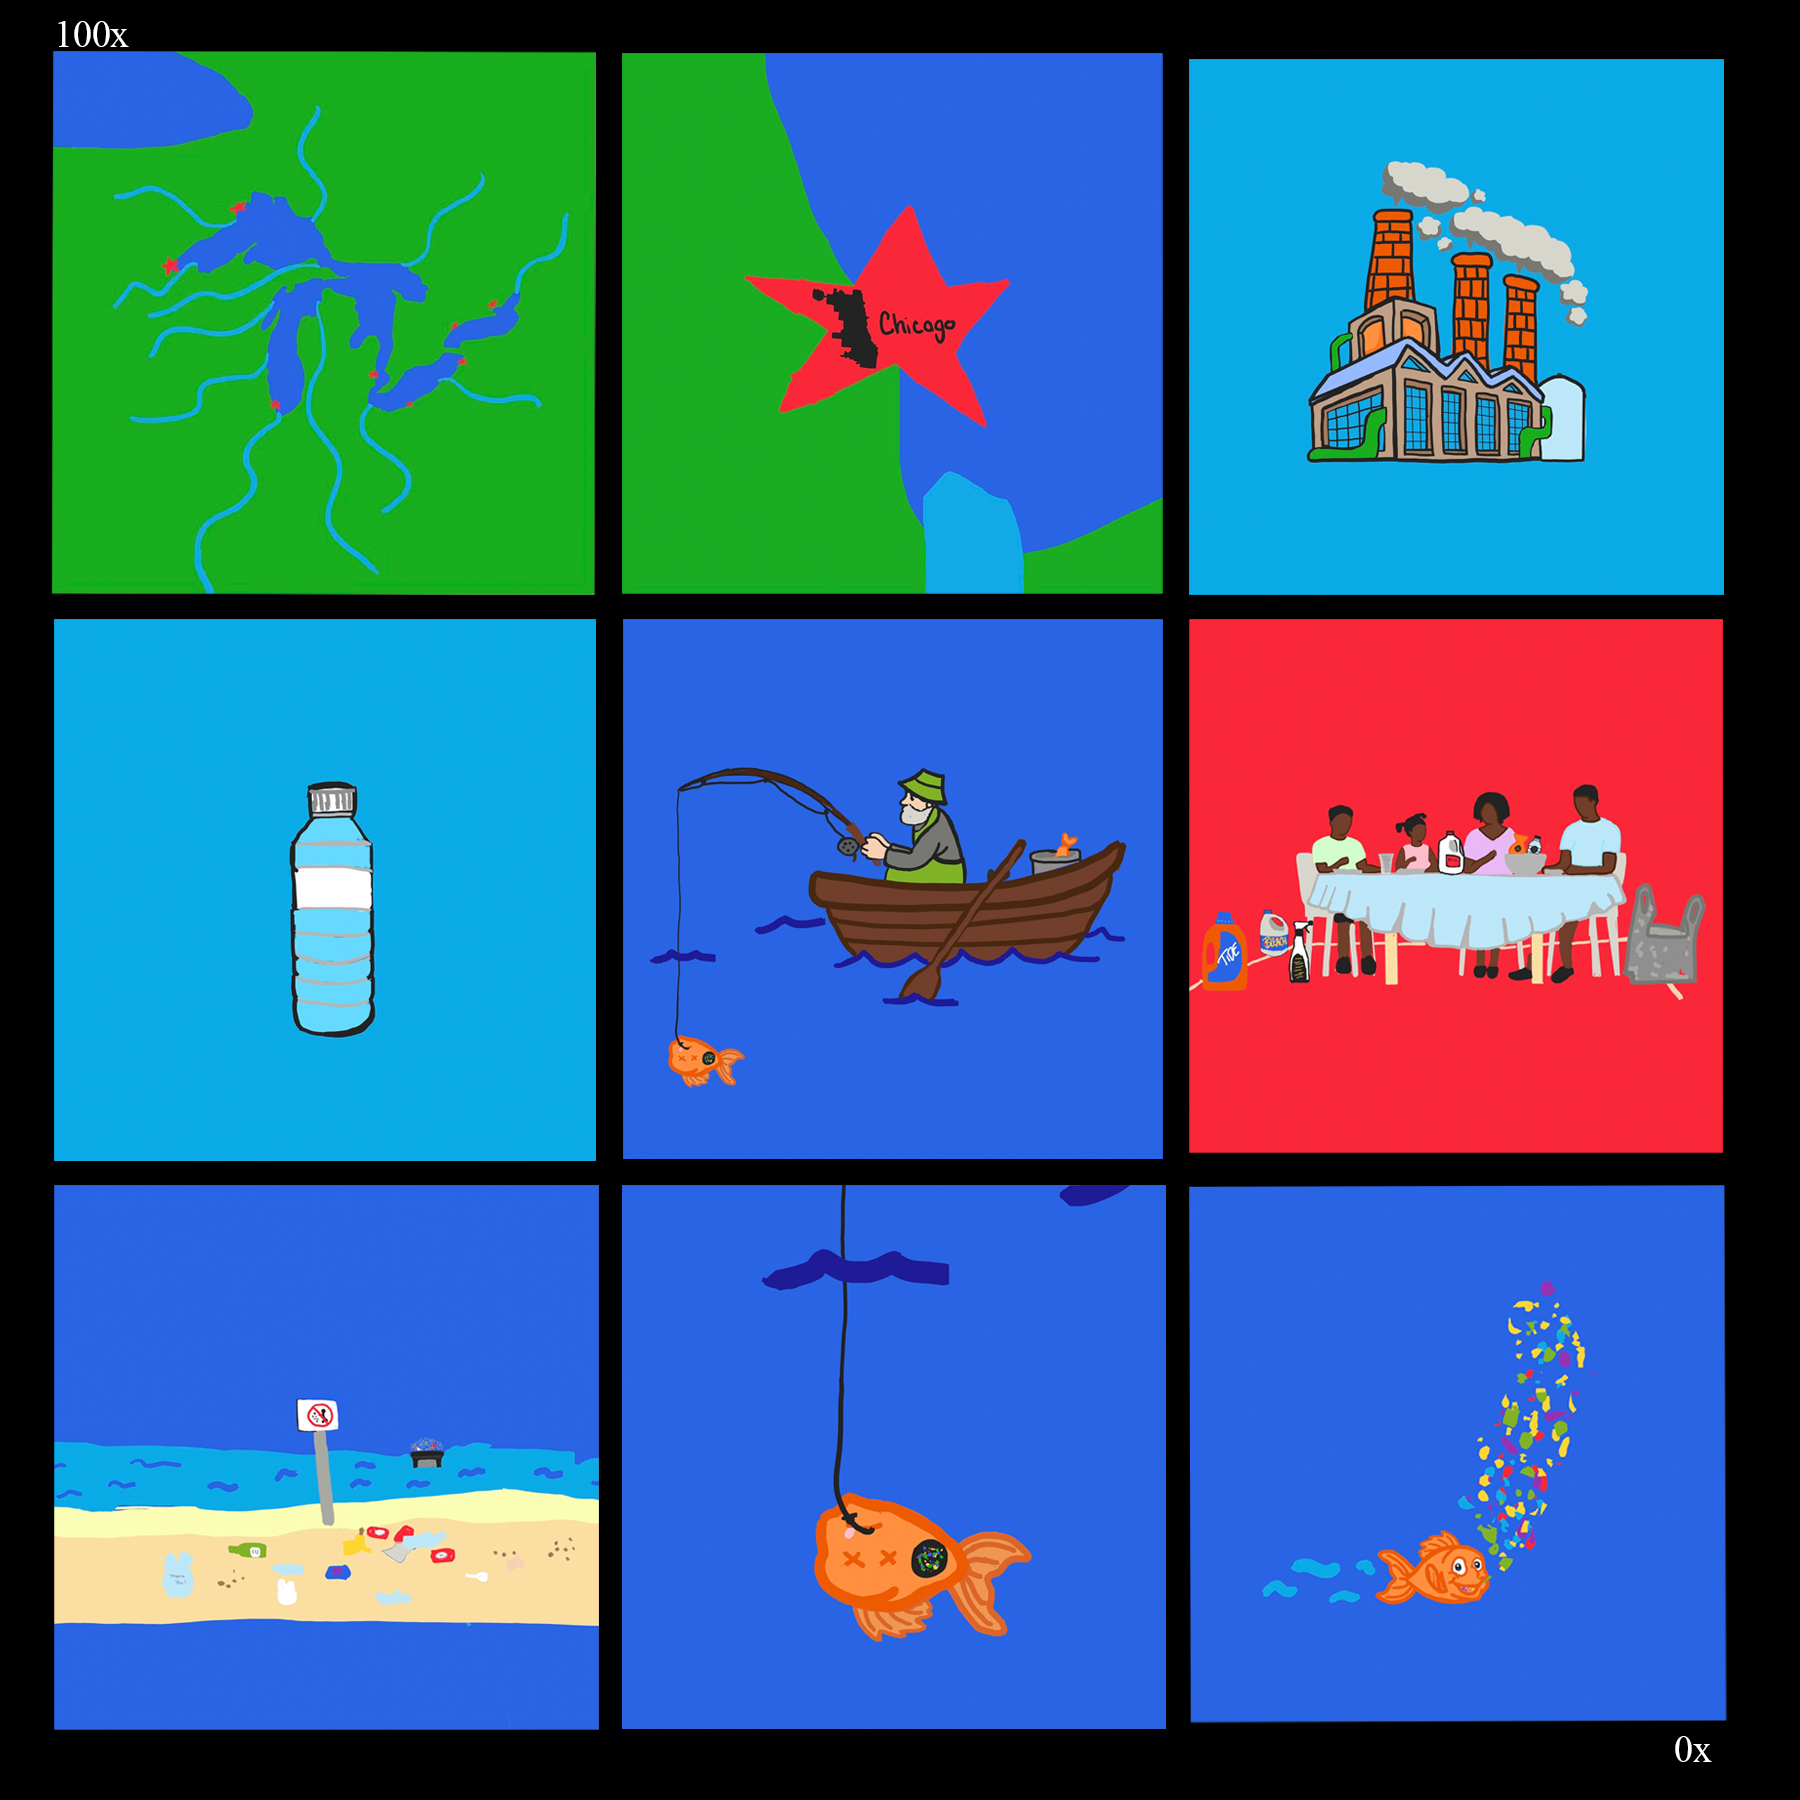
Conclusion: An Endless Paper, and a Scale Board
Our final product is an endless paper drawing that integrates all the analyses, media, and visual representations mentioned above. Viewers can zoom in infinitely to interact with and explore the nuances of the plastic cycle. Additionally, we have created a scale board, which functions as both a guide and a summary of the various scales included—from microplastics to fish, plastic bottles, factories, and ultimately, the entirety of the Great Lakes. Our objective with this scale board is to effectively address the challenge of conceptualizing the scale of plastic pollution, offering a comprehensive and tangible understanding of its magnitude and impact.
This journey through the cycle of plastic brings into sharp focus the urgent need to rethink our relationship with this material. It reveals the environmental cost of convenience and the urgent need to address the inequities in plastic consumption and waste management. Through a combination of visual narratives and spatial analysis, the project emphasizes the pressing call for sustainable practices and policies to mitigate the impact of plastics on our ecosystems and health. The path ahead is clear: transformative action is needed to mitigate the detrimental effects of plastics and to uphold the principles of environmental justice, ensuring a healthier and more balanced world.
Bibliography
A., María Paula Rubiano. “The Event That Changed the Environmental Justice Movement Forever.” Grist, October 29, 2021. https://grist.org/equity/the-event-that-changed-the-environmental-justice-movement-forever/.
Bhuyan, Md. Simul. 2022. “Effects of Microplastics on Fish and in Human Health.” Frontiers in Environmental Science 10 (March). https://doi.org/10.3389/fenvs.2022.827289.
Corcoran, Patricia L., Johanna de Haan Ward, Ian A. Arturo, Sara L. Belontz, Tegan Moore, Carolyn M. Hill-Svehla, Kirsty Robertson, Kelly Wood, and Kelly Jazvac. 2020. “A Comprehensive Investigation of Industrial Plastic Pellets on Beaches across the Laurentian Great Lakes and the Factors Governing Their Distribution.” Science of The Total Environment 747 (December): 141227. doi.org/10.1016/j.scitotenv.2020.141227.
Cox , Kieran, and Garth Covernton. “Human Consumption of Microplastics.” Environmental science & technology. Accessed December 7, 2023. https://pubmed.ncbi.nlm.nih.gov/31184127/#:~:text=Evaluating%20approximately%2015%25%20of%20Americans,121000%20when%20inhalation%20is%20considered
Facts and Figures about Materials, Waste and Recycling | US EPA, www.epa.gov/facts-and-figures-about-materials-waste-and-recycling. Accessed 7 Dec. 2023.
Fish stocking database: https://www.dnr.state.mi.us/fishstock/
https://www.sciencedirect.com/science/article/pii/S0048969720347562
Lohan, Tara. 2021. “New Research Shows Just How Many Fish Are Eating Plastic.” The Revelator. March 4, 2021. https://therevelator.org/fish-eating-plastic/#:~:text=Their%20results%20showed%20that%20386,of%20plastic%20ingestion%20by%20fish.
Pcampillo. “Breaking Free from Foam.” Illinois Environmental Council, 29 Mar. 2023, ilenviro.org/breaking-free-from-foam-how-illinois-and-chicago-can-reduce-plastic-waste/#:~:text=Litter%20is%20a%20persistent%20problem,and%20polystyrene%20food%2Drelated%20items.
———. 2022b. “Effects of Microplastics on Fish and in Human Health.” Frontiers in Environmental Science 10 (March). https://doi.org/10.3389/fenvs.2022.827289. Accessed December 7, 2023
———. 2021b. “New Research Shows Just How Many Fish Are Eating Plastic.” The Revelator. March 4, 2021. https://therevelator.org/fish-eating-plastic/#:%7E:text=Their%20results%20showed%20that%20386,of%20plastic%20ingestion%20by%20fish. Accessed December 7, 2023
Department of Natural Resources. n.d. “Fish Stocking Database.” https://www.dnr.state.mi.us/fishstock/. Accessed December 7, 2023.
“Historical Newspapers from 1700s-2000s.” Historical Newspapers from 1700s-2000s - Newspapers.Com, www.newspapers.com/. Accessed 7 Dec. 2023.
Davies, Phil. “The Number with the Power to Halt the Climate Crisis.” Ensia, 11 June 2019, ensia.com/features/social-cost-carbon-greenhouse-gas-climate-crisis/.
Pearce, Fred, et al. “As North Sea Oil Wanes, Removing Abandoned Rigs Stirs Controversy.” Yale E360, Yale School of the Environment, 26 June 2018, e360.yale.edu/features/as-north-sea-oil-wanes-removing-abandoned-rigs-stirs-controversy.
“How Freight Trains Connect the World - Logistics Asia.” Logistics Asia - Logistics Asia Bring the Latest News and Insights on Logistics in Asia and Beyond., Carriers, 21 May 2021, logistics.asia/how-freight-trains-connect-the-world/.
Attributions
Miya Khoo - Stage 1 and all relevant maps, collages, and outsourced images “01_Plastic_Cycle_Stage 1_Infographic”
Dakota Harris - Stage 2 and all relevant maps, collages, and outsourced images “04_Plastic Cycle Stage 2_Usage,Access,EJCollageMap” & “FinalScenographicMap.MOV”
Rose Aceves - Stage 3 and all relevant maps, collages, and outsourced images “15_Plastic Cycle Stage 3_Overview Infographics” & “Plastic_Cycle_scale_scenograph”
Chloe Gao - Stage 4 and all relevant maps, collages, and outsourced images “19_Plastic Cycle Stage 4_Overview Infographics”
[1] Cox , Kieran, and Garth Covernton. “Human Consumption of Microplastics.” Environmental science & technology. Accessed December 7, 2023. https://pubmed.ncbi.nlm.nih.gov/31184127/#:~:text=Evaluating%20approximately%2015%25%20of%20Americans,121000%20when%20inhalation%20is%20considered
[2] A., María Paula Rubiano. “The Event That Changed the Environmental Justice Movement Forever.” Grist, October 29, 2021. https://grist.org/equity/the-event-that-changed-the-environmental-justice-movement-forever/.
[3]Facts and Figures about Materials, Waste and Recycling | US EPA,www.epa.gov/facts-and-figures-about-materials-waste-and-recycling. Accessed 7 Dec. 2023.
Pcampillo. “Breaking Free from Foam.” Illinois Environmental Council, 29 Mar. 2023, ilenviro.org/breaking-free-from-foam-how-illinois-and-chicago-can-reduce-plastic-waste/#:~:text=Litter%20is%20a%20persistent%20problem,and%20polystyrene%20food%2Drelated%20items.
[4] ———. 2022b. “Effects of Microplastics on Fish and in Human Health.” Frontiers in Environmental Science 10 (March). https://doi.org/10.3389/fenvs.2022.827289. Accessed December 7, 2023
[5] ———. 2021b. “New Research Shows Just How Many Fish Are Eating Plastic.” The Revelator. March 4, 2021. https://therevelator.org/fish-eating-plastic/#:%7E:text=Their%20results%20showed%20that%20386,of%20plastic%20ingestion%20by%20fish. Accessed December 7, 2023
[6] Corcoran, Patricia L., Johanna De Haan Ward, Ian A. Arturo, Sara L. Belontz, Tegan Moore, Carolyn M. Hill-Svehla, Kirsty Robertson, Kelly Wood, and Kelly Jazvac. 2020. “A Comprehensive Investigation of Industrial Plastic Pellets on Beaches across the Laurentian Great Lakes and the Factors Governing Their Distribution.” Science of the Total Environment 747 (December): 141227. https://doi.org/10.1016/j.scitotenv.2020.141227. Accessed December 7, 2023
[7] Department of Natural Resources. n.d. “Fish Stocking Database.” https://www.dnr.state.mi.us/fishstock/. Accessed December 7, 2023.