STUDIO PRIMER B: ANNOTATING SPATIAL SYSTEMS, FROM FLOW CHARTS TO SYSTEMS DIAGRAMS
Overview
Annotation of geographic process and spatial systems has a surprisingly creative history. This brief primer on annotational diagrams of system and process should give you a sense of how you might deploy the techniques shown below in your own work using relatively simple workflows between QGIS and Illustrator from the previous labs. The real work is in composition, and thinking carefully, critically, and creatively about how you classify the elements of a system, how you draw a boundary around it, and how you connect those elements within and beyond the system.
We’ll begin by exploring the diagrammatic work of systems ecologist H.T. Odum (and his collaborators), viz., the modern systems diagram. Systems diagrams are a subgenre of the more widely-recognized “flow” or “process chart.” How we understand flow and process — and the physical analogues and metaphors we use to model them — is crucial for how we understand what constitutes a “system,” geographic or otherwise. This apparent in the stylistic changes of Odum’s diagrams over time: he moved from a more mimetic style of diagram (in which flows of energy appear sinuous and fluid, like a river and its tributaries)…
![]()
Odum, Howard T. “Primary Production in Flowing Waters.” Limnology and Oceanography 1, no. 2 (1956): 102–17. doi.org/10.4319/lo.1956.1.2.0102.
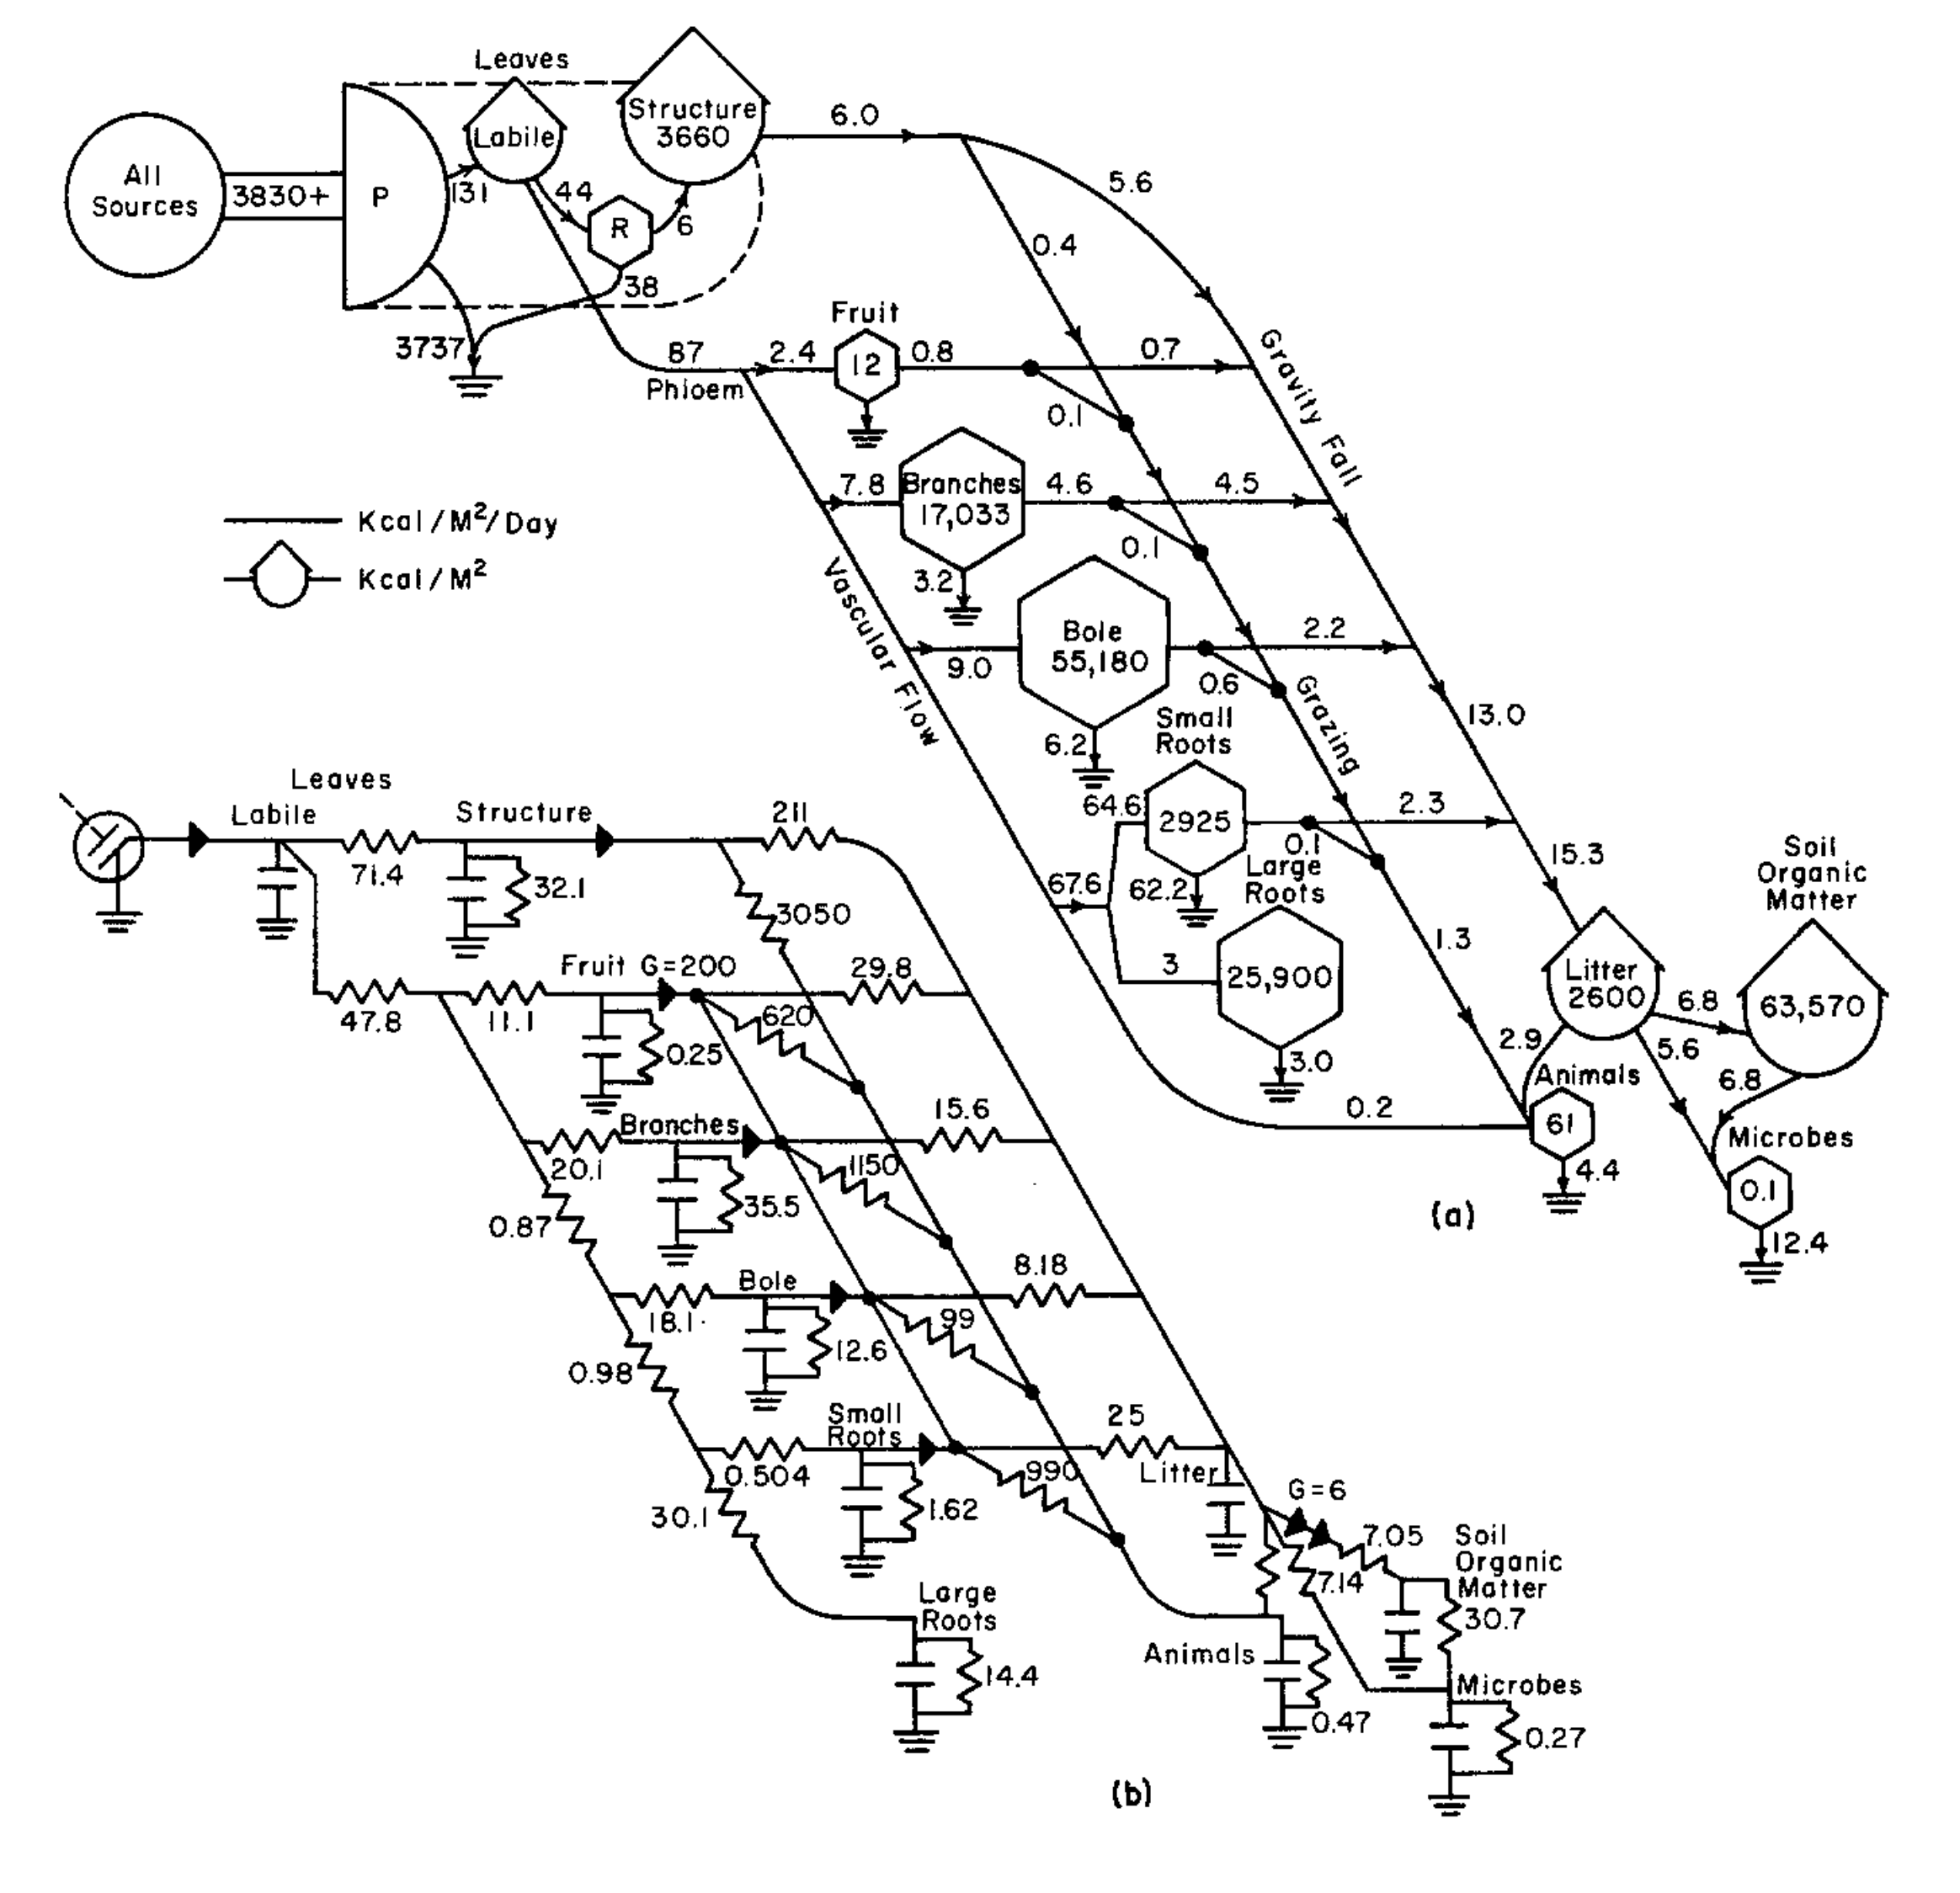
…to a more technical energy systems “language” mirroring contemporaneous computing circuit diagrams, in which different symbols represent different functions and entities in the system.
![]()
![]()
Left: Symbols of the Energy Language. (a) Source; (b) heat sink; © storage; (d) interaction; (e) money exchange transaction; (f) producer; (g) consumer; (h) switching subsystem; (i) cycling receptor; (j) constant gain amplifier; (k) miscellaneous symbol for subsystems.
Right: From Odum, Howard T. Systems Ecology: An Introduction. New York: Wiley, 1983. Frontmatter.
The key point here is that as a genre of spatial media, the resulting systems diagram and its operational “grammar” allowed for a generalized application of the diagram beyond ecology as long as the object of representation could be portrayed as a system.
By that logic, entire countries could be represented as systems of energetic inputs, outputs, and socio-metabolic processes. It was not long until these diagrammatic representations were rescaled to the world system and planetary socio-metabolism. In the case of Jay Forrester’s work at MIT on a series of “world models,” the diagrams also represented the logical circuitry of computer programs built to simulate different outcomes based on various resource allocation, energy production and consumption, rates of population growth, and other key sociometabolic variables.
![]()
![]()
Left: Odum, H.T. Energy Analysis Overview of Brazil, in Energy Systems Overview of the Amazon Basin, Odum H.T., Brown M.T., Christianson R.A., Center for Wetlands, University of Florida, Gainesville, pp. 64–81
Right: Jay Forrester, World3, Diagram of limits to growth in the world system, Commissioned by the Club of Rome, 1972.
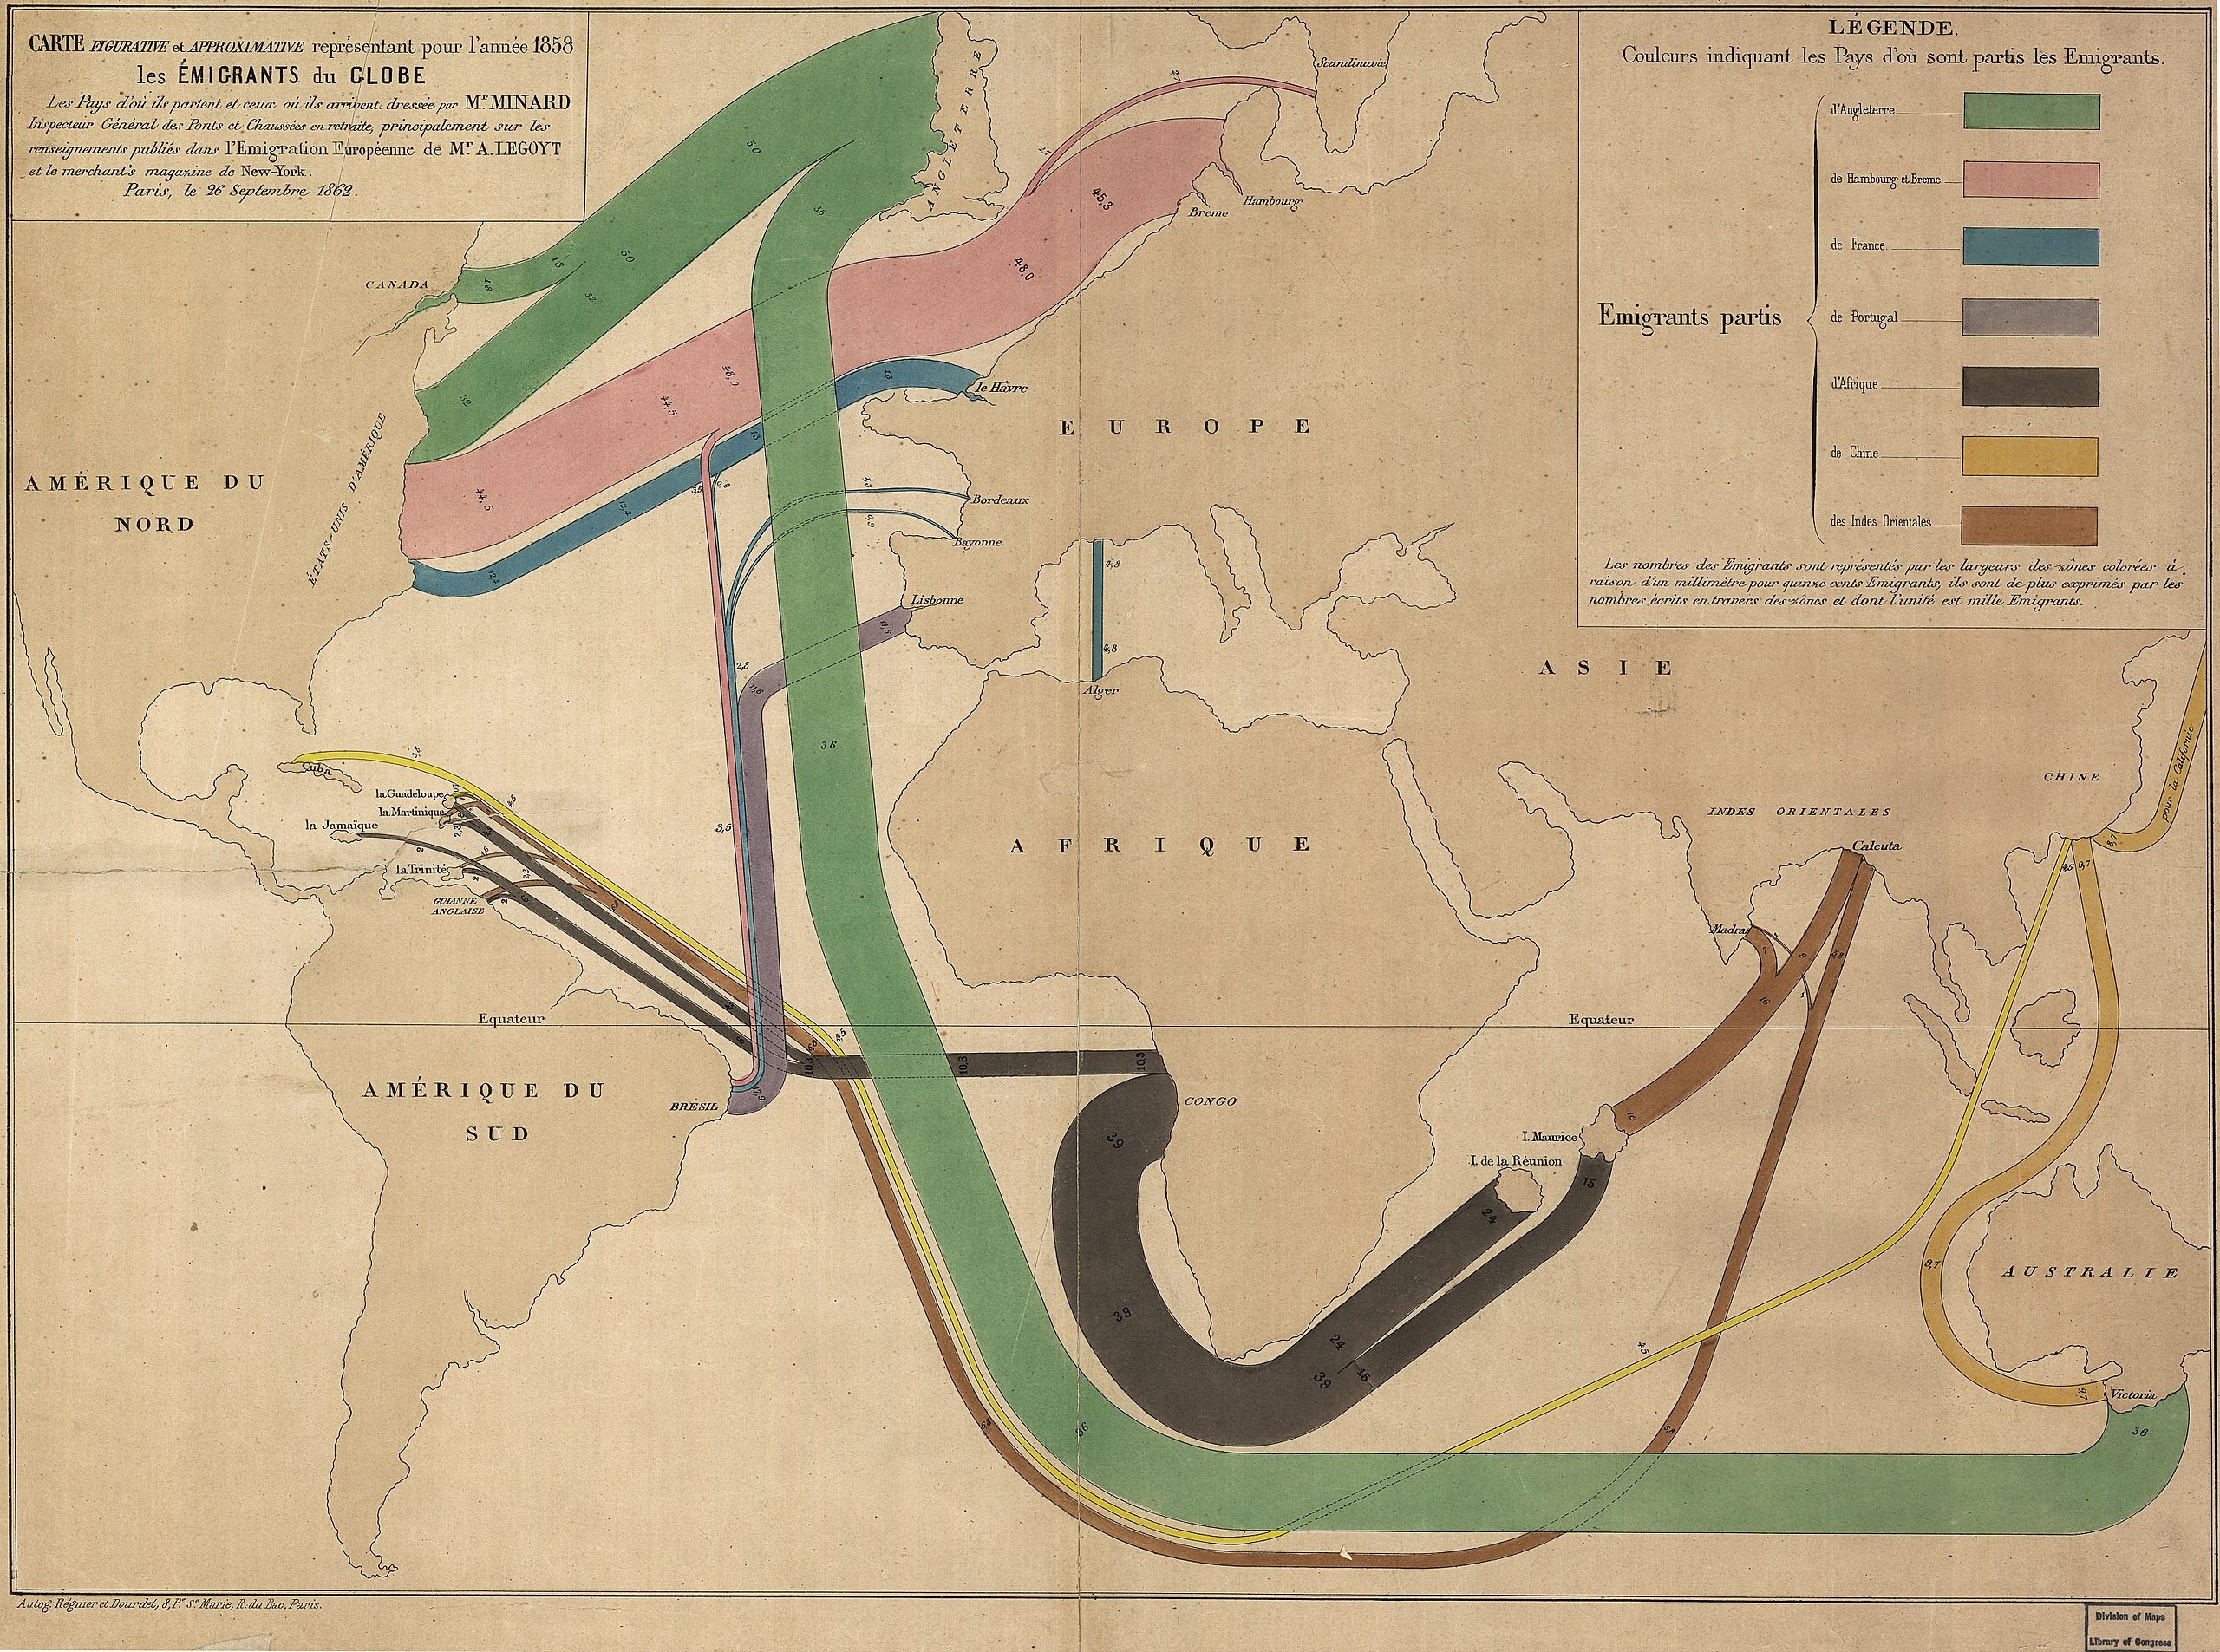
While energy systems diagrams date from the early post-war period (during Odum’s) involvement with U.S. Atomic Energy Commission and its nuclear weapons testing program), they borrow heavily from at least four earlier lineages: i) geographic diagrams of movement (especially of people, exemplified by Gemelli’s 1704 Aztec migration map and the works of Charles Joseph Minard)…
![]()
![]()
L: Gemelli Careri, Giovanni Francesco, and Awnsham Churchill. A Voyage Round the World, Vol. VI. Of New-Spain. 1704.
R: Charles Joseph Minard, 1862. Carte figurative et approximative représentant pour l’année 1858 les émigrants du globe, les pays dóu ils partent et ceux oú ils arrivent.
ii) control engineering for thermodynamic systems (exemplified by Irish engineer Matthew Riall Sankey’s diagrams first published in 1898)…
![]()
iii) early-20th century industrial and supply-chain standardization (exemplified by Lillian and Frank Gilbreth’s “process charts”)…
![]()
![]()
L: Figure 5 from Gilbreth, Frank Bunker, and Lillian Moller Gilbreth. “Process Charts.” New York, NY: American Society of Mechanical Engineers, 1921. .
R: Figure 4 from Gilbreth, Frank Bunker, and Lillian Moller Gilbreth. “Process Charts.” New York, NY: American Society of Mechanical Engineers, 1921. https://lccn.loc.gov/ca22000471.
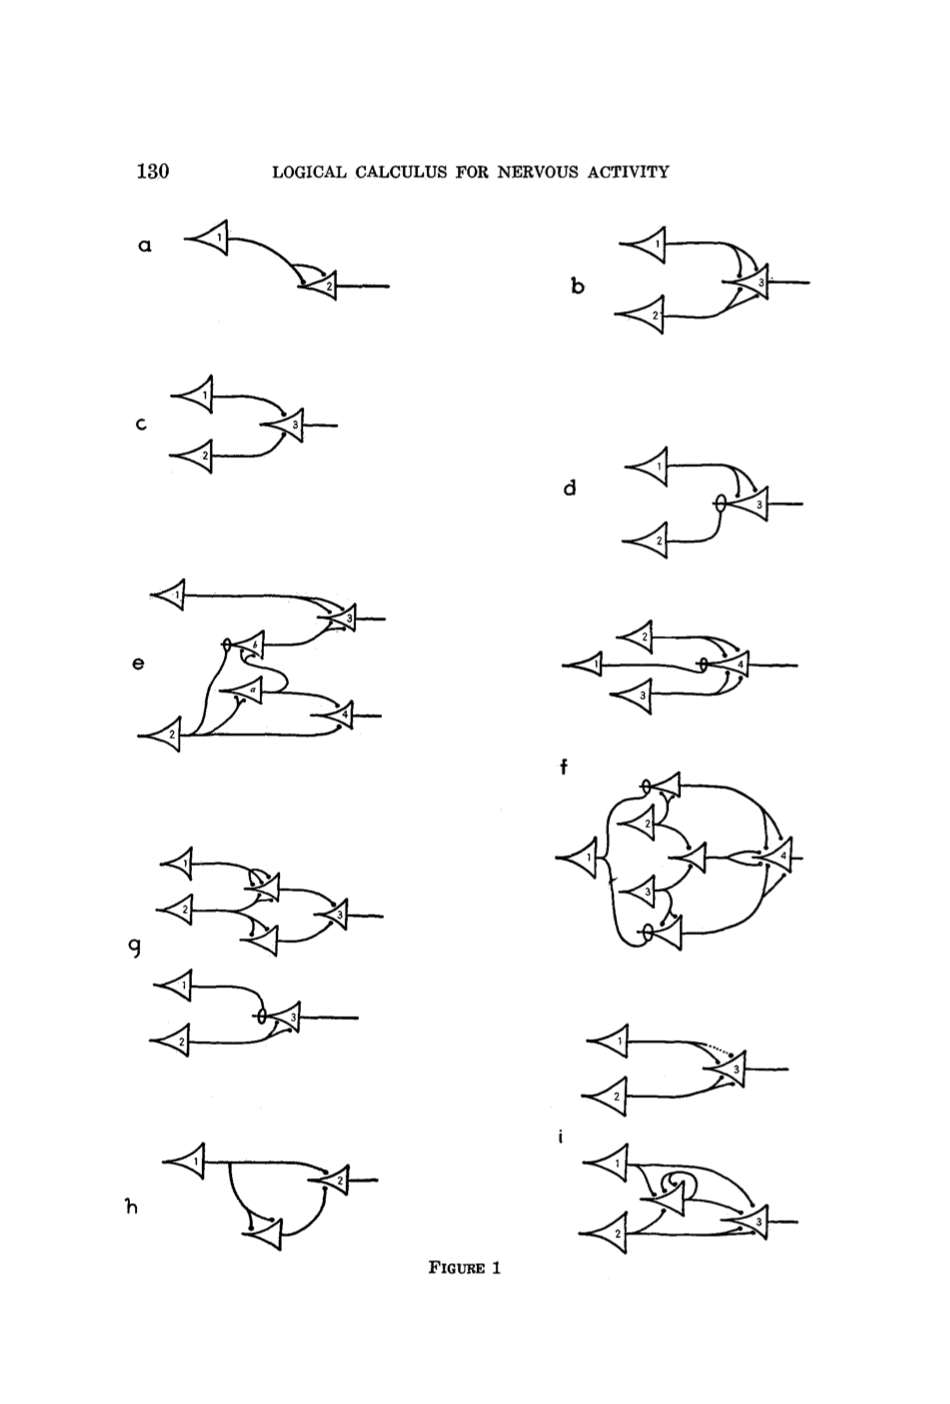
…and iv) the design of analog electronic computing circuits during the build-up to World War II (exemplified by mathematician John von Neumann’s development of electronic computing apparatus for the U.S. military), which were closely associated with early “cybernetic” efforts to represent the brain as a computer and model neuronal pathways as circuits (exemplified by Warren McCulloch and Walter Pitts’ “logical calculus” of neuronal activity).
![]()
![]()
L: Figures 7.2 & 8.2, showing electronic computing circuits, from Goldstine, Herman H., and John Von Neumann. “Planning and Coding of Problems for an Electronic Computing Instrument.” Report on the Mathematical and Logical Aspects of an Electronic Computing Instrument, Part II, Vol. 1–3. Princeton, N.J.: Institute for Advanced Study, 1947.
R: Figure 1, showing from neuronal circuits, from McCulloch, Warren S., and Walter Pitts. “A Logical Calculus of the Ideas Immanent in Nervous Activity.” The Bulletin of Mathematical Biophysics 5, no. 4 (December 1, 1943): 115–33. https://doi.org/10.1007/BF02478259.
This abbreviated genealogy suggests a close affinity between the diagram styles (and they way they represent systems, process, and flow) and dominant theoretical systems, political economic concerns, and the science and technology of the time. Alternative, critical projects emerged to counter-map those very systems: the work of Marc Lombardi, for instance, who painstakingly mapped financial networks by hand during the rise of deregulated, neoliberal markets from the 1970s onward; or the quasi-paranoid “world-systems” maps of power by French anarchist art collective Bureau d’Etudes in the years after 9/11.
![]()
![]()
![]()
![]()
Bureau d’Etudes, 2005-2006: Diagrams of global media control by transnational corporations and state actors (top); diagrams from maps of Agro-Food Industry power, including “pictographic grammar.”
We can see all these legacies at work in contemporary attempts to diagram how systems work across increasingly indistinguishable social and natural spaces, like Kate Crawford and Vladan Joler’s Anatomy of an AI project.
![]()
This “anatomy” takes the form of a systems diagram of intricate detail and idiosyncratic uses of diagrammatic convention from across the examples above. For instance, they develop their own symbolic grammar to represent elements of the labor process from a Marxian perspective (labor power, products/commodities, the means of production, and waste).
![]()
![]()
They deploy different drawing styles (realistic wireframes, maps, cross-sections, a periodic table, geometric diagrams) to capture the heterogeneity of the parts of the system while using a variety of linework styles and widths to represent different kinds of connections between those parts. Finally, they organize it compositionally such that reading from left to right follows an expanded “lifecycle” of the particular artifact they’re interested in mapping, the Amazon Echo Dot, from mineral extraction and logistical distribution to internet infrastructure through to abandonment and disposal. In each of these last three examples, we see a mode of tracing and annotating systems not as maps of energy, information, population, or material flows, but of power and its operations.
This second primer sketches a genealogy of different approaches to representing spatial systems, process, movement, and difference. Here we explore the use of symbolic annotation to elucidate an underlying spatial grammar, focusing on various iterations of the “systems diagram.”
Overview
Annotation of geographic process and spatial systems has a surprisingly creative history. This brief primer on annotational diagrams of system and process should give you a sense of how you might deploy the techniques shown below in your own work using relatively simple workflows between QGIS and Illustrator from the previous labs. The real work is in composition, and thinking carefully, critically, and creatively about how you classify the elements of a system, how you draw a boundary around it, and how you connect those elements within and beyond the system.
We’ll begin by exploring the diagrammatic work of systems ecologist H.T. Odum (and his collaborators), viz., the modern systems diagram. Systems diagrams are a subgenre of the more widely-recognized “flow” or “process chart.” How we understand flow and process — and the physical analogues and metaphors we use to model them — is crucial for how we understand what constitutes a “system,” geographic or otherwise. This apparent in the stylistic changes of Odum’s diagrams over time: he moved from a more mimetic style of diagram (in which flows of energy appear sinuous and fluid, like a river and its tributaries)…

Odum, Howard T. “Primary Production in Flowing Waters.” Limnology and Oceanography 1, no. 2 (1956): 102–17. doi.org/10.4319/lo.1956.1.2.0102.
…to a more technical energy systems “language” mirroring contemporaneous computing circuit diagrams, in which different symbols represent different functions and entities in the system.
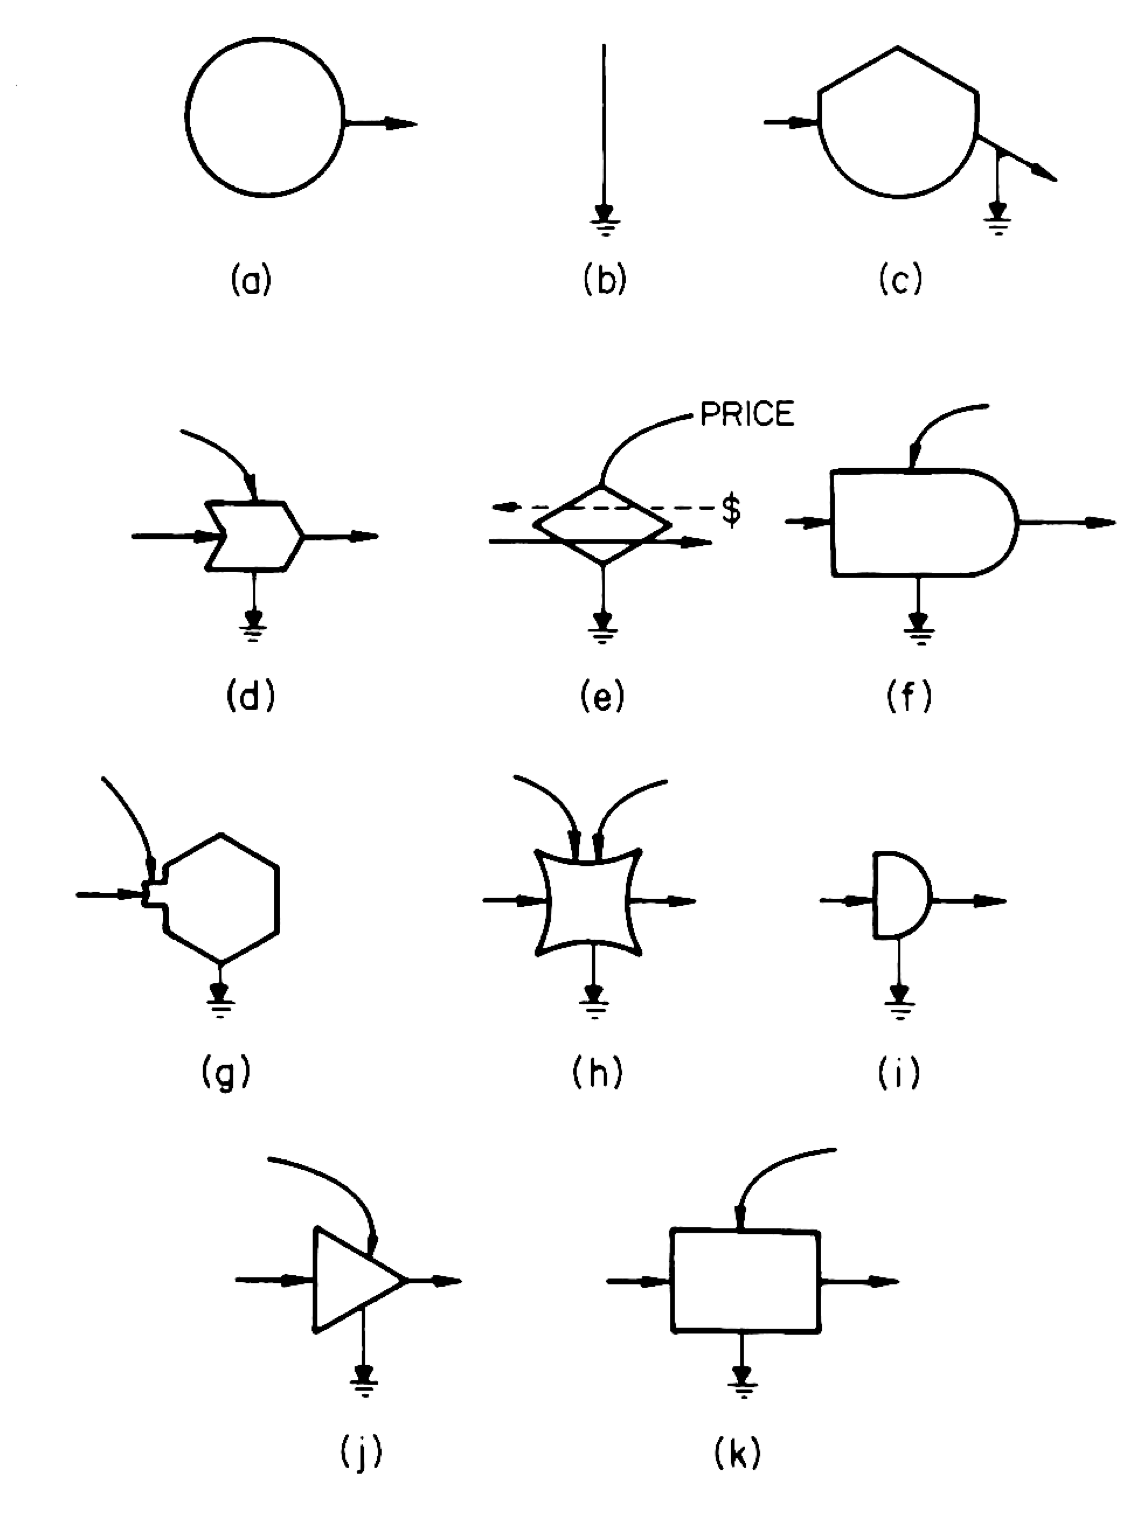
Left: Symbols of the Energy Language. (a) Source; (b) heat sink; © storage; (d) interaction; (e) money exchange transaction; (f) producer; (g) consumer; (h) switching subsystem; (i) cycling receptor; (j) constant gain amplifier; (k) miscellaneous symbol for subsystems.
Right: From Odum, Howard T. Systems Ecology: An Introduction. New York: Wiley, 1983. Frontmatter.
Odum, Howard T, ‘Summary: An Emerging View of the Ecological System at E1 Verde’, in H. T. Odum and R. F. Pigeon (eds.), A Tropical Rain Forest: A Study of Irradiation and Ecology at El Verde, Puerto Rico. Oak Ridge, Tenn.: U.S. Atomic Energy Commission, 1970. pp. I191 — I289.
The key point here is that as a genre of spatial media, the resulting systems diagram and its operational “grammar” allowed for a generalized application of the diagram beyond ecology as long as the object of representation could be portrayed as a system.
By that logic, entire countries could be represented as systems of energetic inputs, outputs, and socio-metabolic processes. It was not long until these diagrammatic representations were rescaled to the world system and planetary socio-metabolism. In the case of Jay Forrester’s work at MIT on a series of “world models,” the diagrams also represented the logical circuitry of computer programs built to simulate different outcomes based on various resource allocation, energy production and consumption, rates of population growth, and other key sociometabolic variables.


Left: Odum, H.T. Energy Analysis Overview of Brazil, in Energy Systems Overview of the Amazon Basin, Odum H.T., Brown M.T., Christianson R.A., Center for Wetlands, University of Florida, Gainesville, pp. 64–81
Right: Jay Forrester, World3, Diagram of limits to growth in the world system, Commissioned by the Club of Rome, 1972.
While energy systems diagrams date from the early post-war period (during Odum’s) involvement with U.S. Atomic Energy Commission and its nuclear weapons testing program), they borrow heavily from at least four earlier lineages: i) geographic diagrams of movement (especially of people, exemplified by Gemelli’s 1704 Aztec migration map and the works of Charles Joseph Minard)…
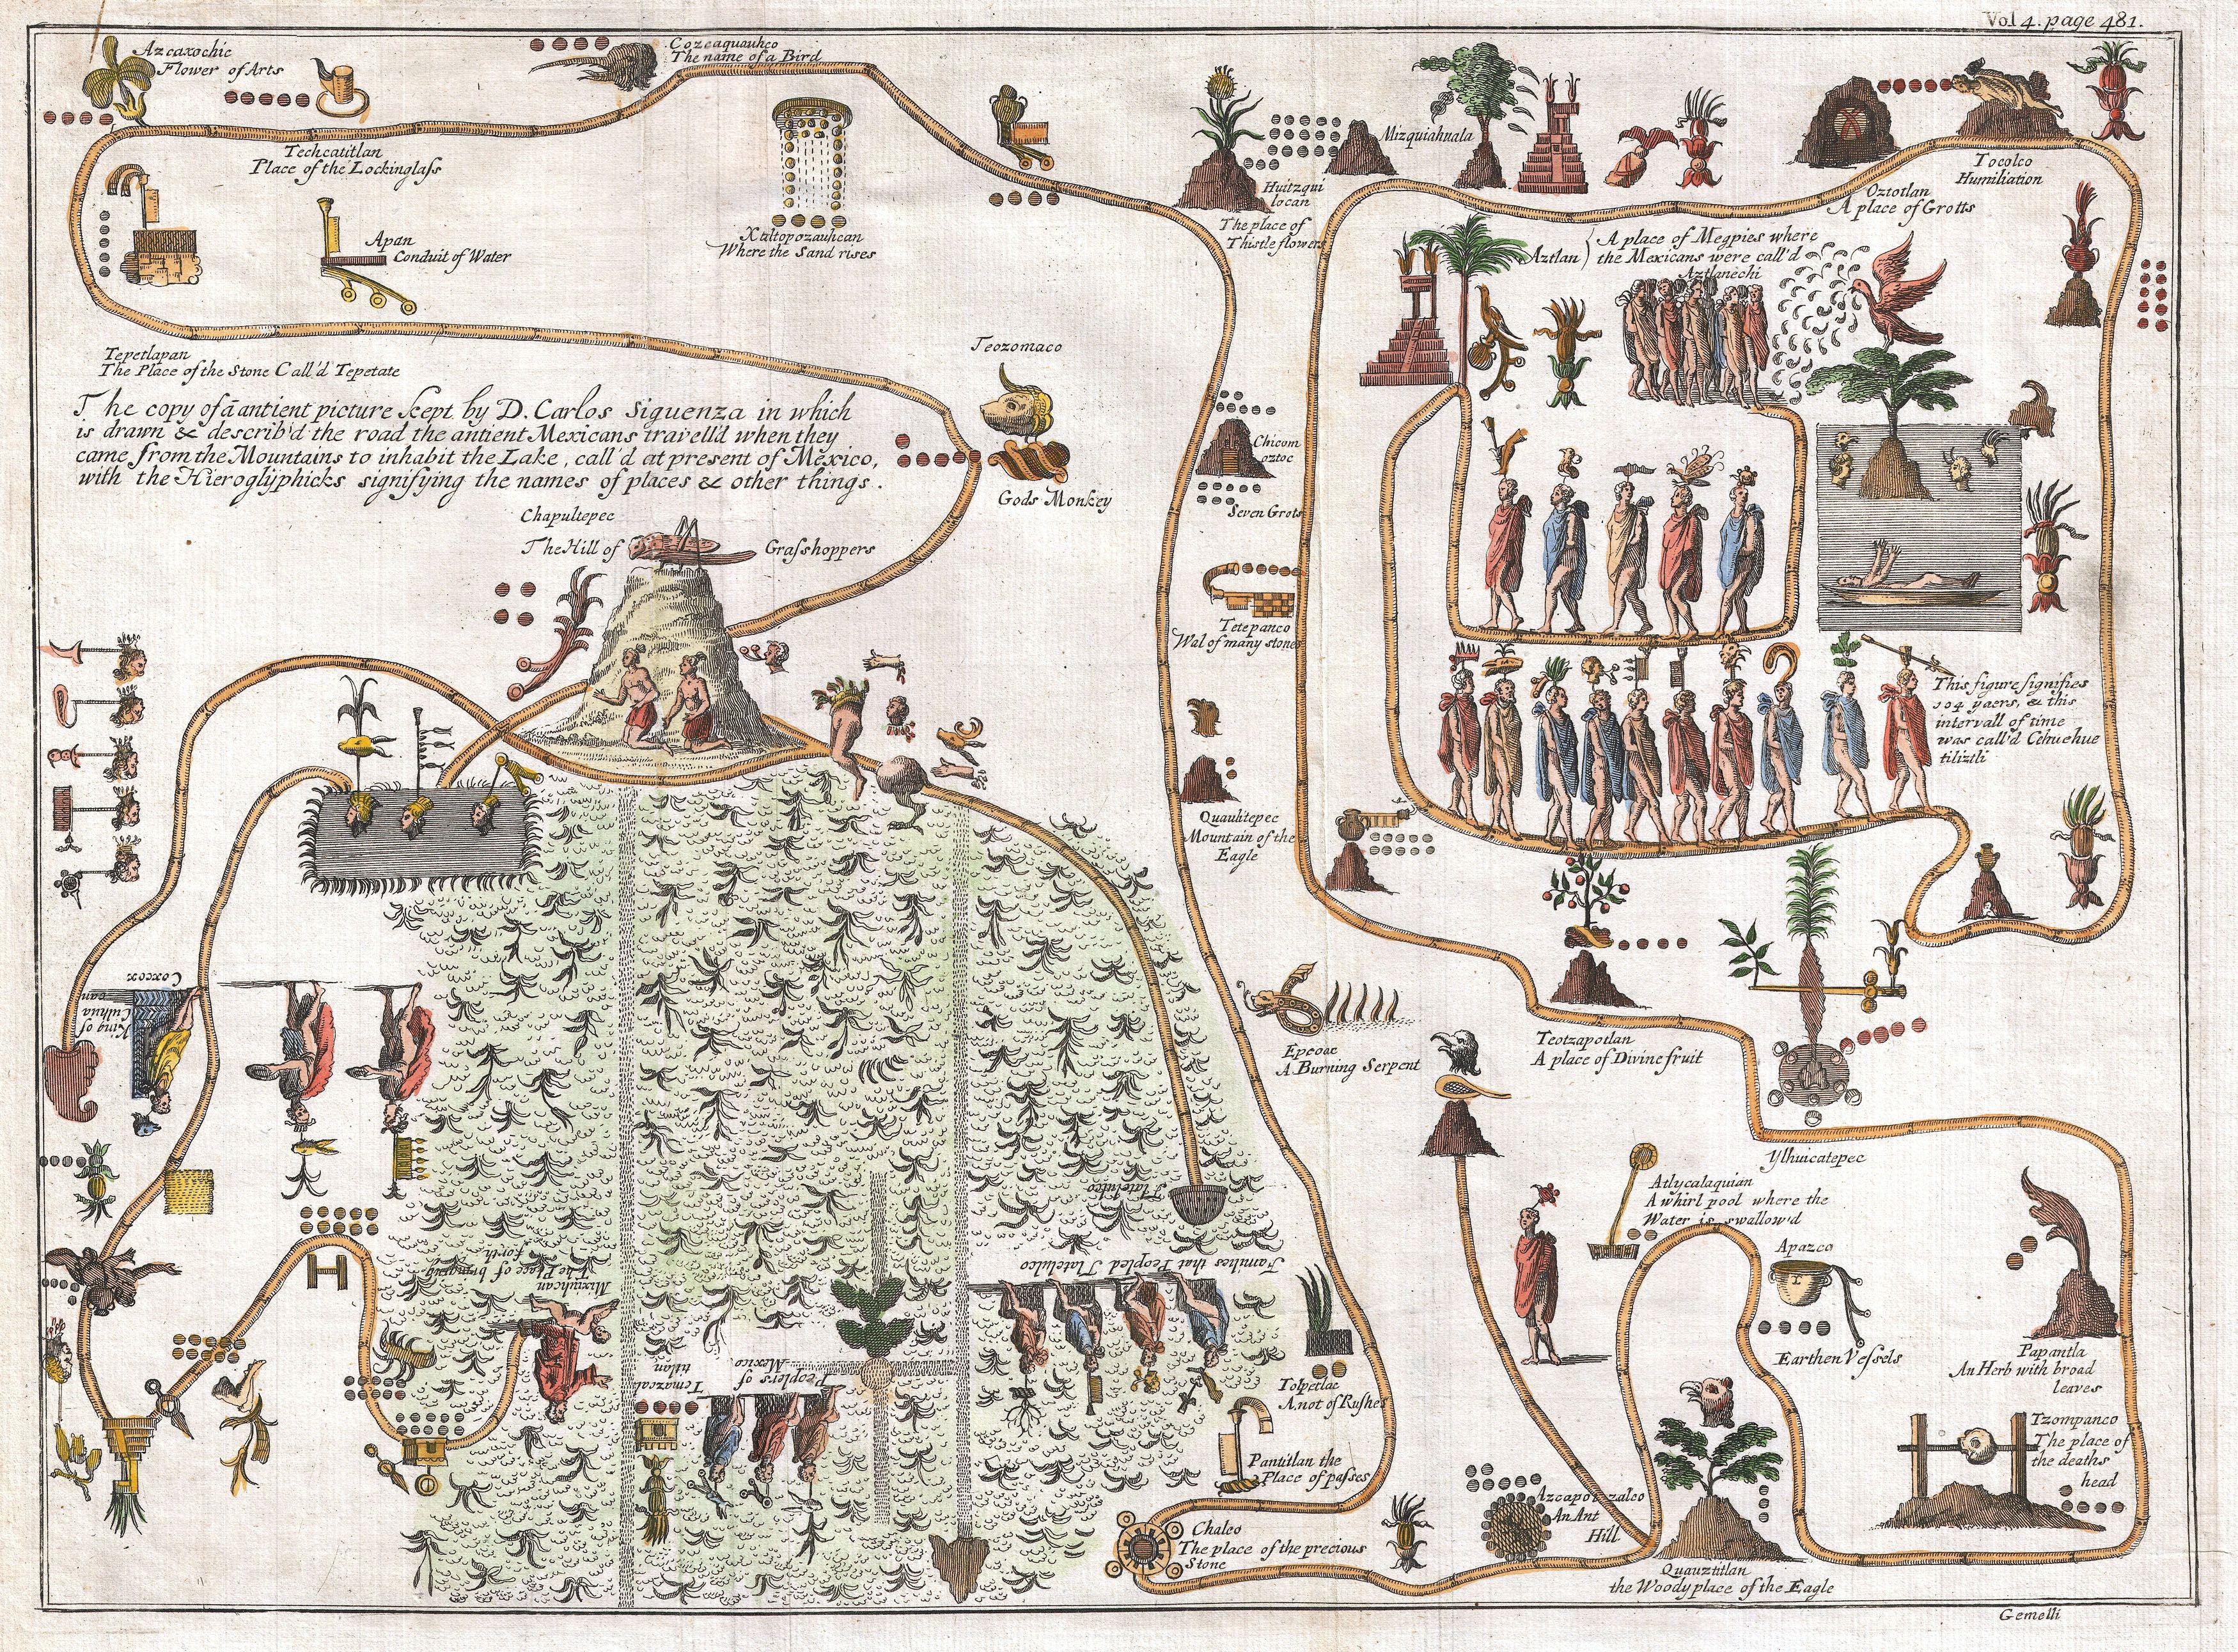
L: Gemelli Careri, Giovanni Francesco, and Awnsham Churchill. A Voyage Round the World, Vol. VI. Of New-Spain. 1704.
R: Charles Joseph Minard, 1862. Carte figurative et approximative représentant pour l’année 1858 les émigrants du globe, les pays dóu ils partent et ceux oú ils arrivent.
ii) control engineering for thermodynamic systems (exemplified by Irish engineer Matthew Riall Sankey’s diagrams first published in 1898)…

Sankey Diagram drawn by M. Sankey, from
“The Thermal Efficiency Of Steam Engines” in
Minutes of Proceedings of The Institution of Civil Engineers.
Vol. CXXXIV, Session 1897–98. Part IV.
“The Thermal Efficiency Of Steam Engines” in
Minutes of Proceedings of The Institution of Civil Engineers.
Vol. CXXXIV, Session 1897–98. Part IV.
iii) early-20th century industrial and supply-chain standardization (exemplified by Lillian and Frank Gilbreth’s “process charts”)…


L: Figure 5 from Gilbreth, Frank Bunker, and Lillian Moller Gilbreth. “Process Charts.” New York, NY: American Society of Mechanical Engineers, 1921. .
R: Figure 4 from Gilbreth, Frank Bunker, and Lillian Moller Gilbreth. “Process Charts.” New York, NY: American Society of Mechanical Engineers, 1921. https://lccn.loc.gov/ca22000471.
…and iv) the design of analog electronic computing circuits during the build-up to World War II (exemplified by mathematician John von Neumann’s development of electronic computing apparatus for the U.S. military), which were closely associated with early “cybernetic” efforts to represent the brain as a computer and model neuronal pathways as circuits (exemplified by Warren McCulloch and Walter Pitts’ “logical calculus” of neuronal activity).

L: Figures 7.2 & 8.2, showing electronic computing circuits, from Goldstine, Herman H., and John Von Neumann. “Planning and Coding of Problems for an Electronic Computing Instrument.” Report on the Mathematical and Logical Aspects of an Electronic Computing Instrument, Part II, Vol. 1–3. Princeton, N.J.: Institute for Advanced Study, 1947.
R: Figure 1, showing from neuronal circuits, from McCulloch, Warren S., and Walter Pitts. “A Logical Calculus of the Ideas Immanent in Nervous Activity.” The Bulletin of Mathematical Biophysics 5, no. 4 (December 1, 1943): 115–33. https://doi.org/10.1007/BF02478259.
This abbreviated genealogy suggests a close affinity between the diagram styles (and they way they represent systems, process, and flow) and dominant theoretical systems, political economic concerns, and the science and technology of the time. Alternative, critical projects emerged to counter-map those very systems: the work of Marc Lombardi, for instance, who painstakingly mapped financial networks by hand during the rise of deregulated, neoliberal markets from the 1970s onward; or the quasi-paranoid “world-systems” maps of power by French anarchist art collective Bureau d’Etudes in the years after 9/11.
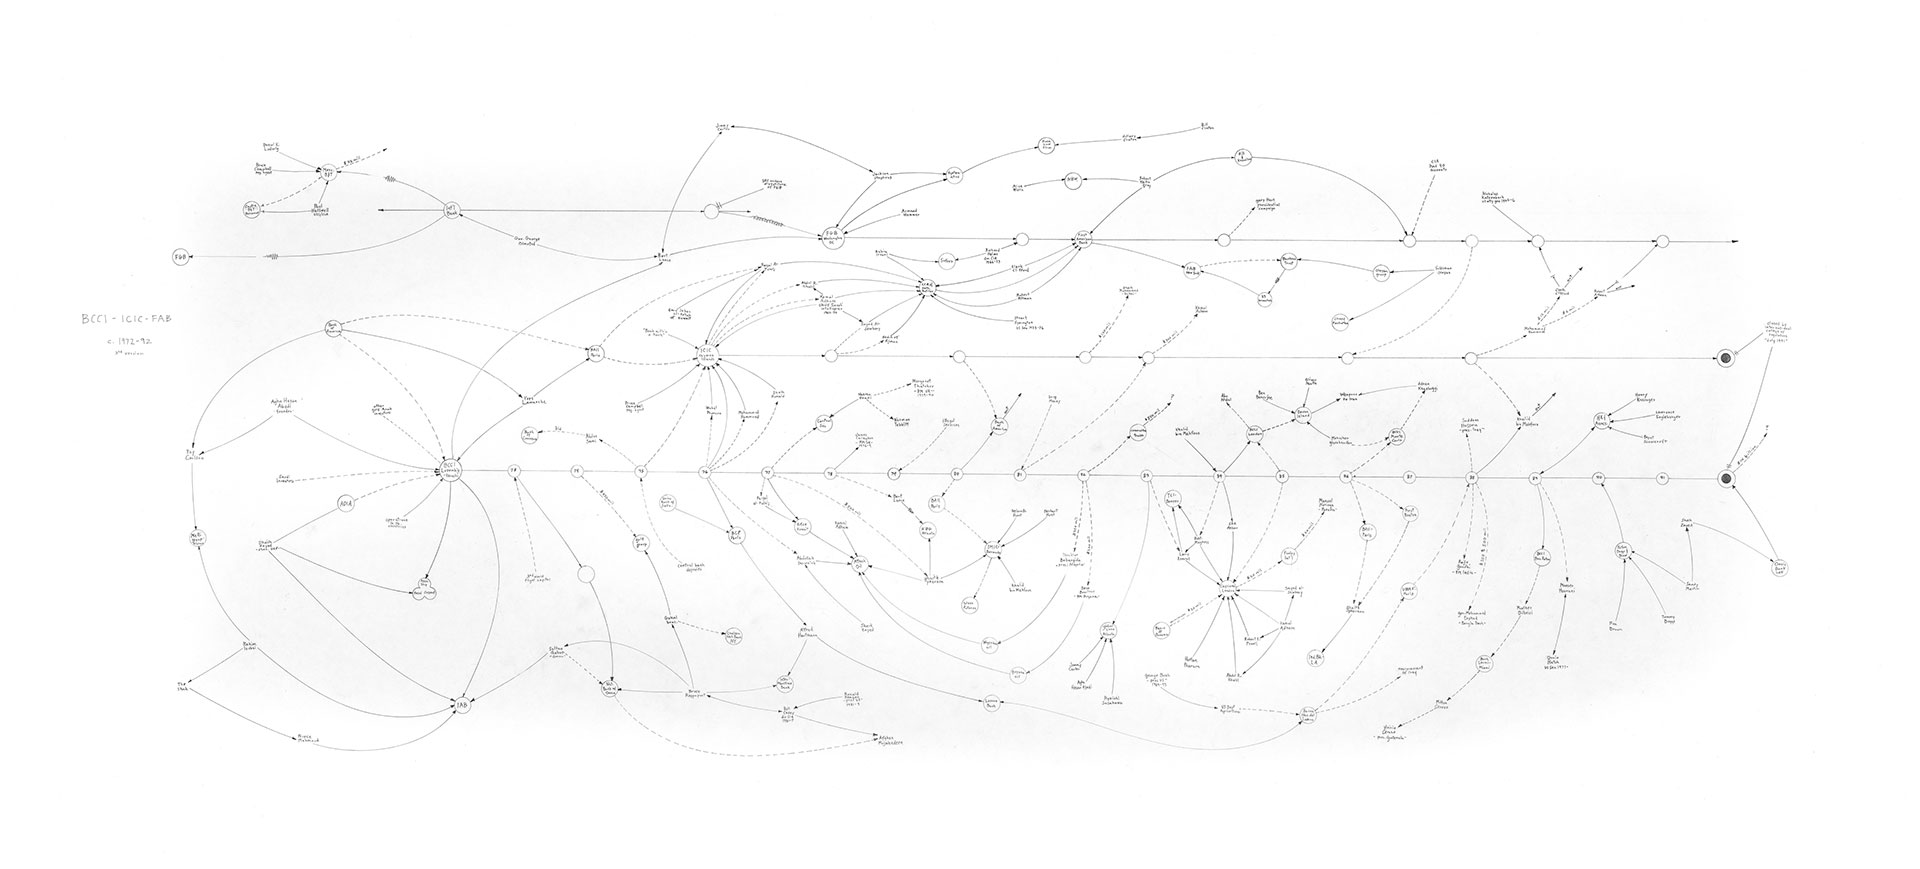
Mark Lombardi, “BCCI, ICIC and First American Bankshares c.1972-92”, 3rd Version, 1996. Whitney Museum of Contemporary Art.
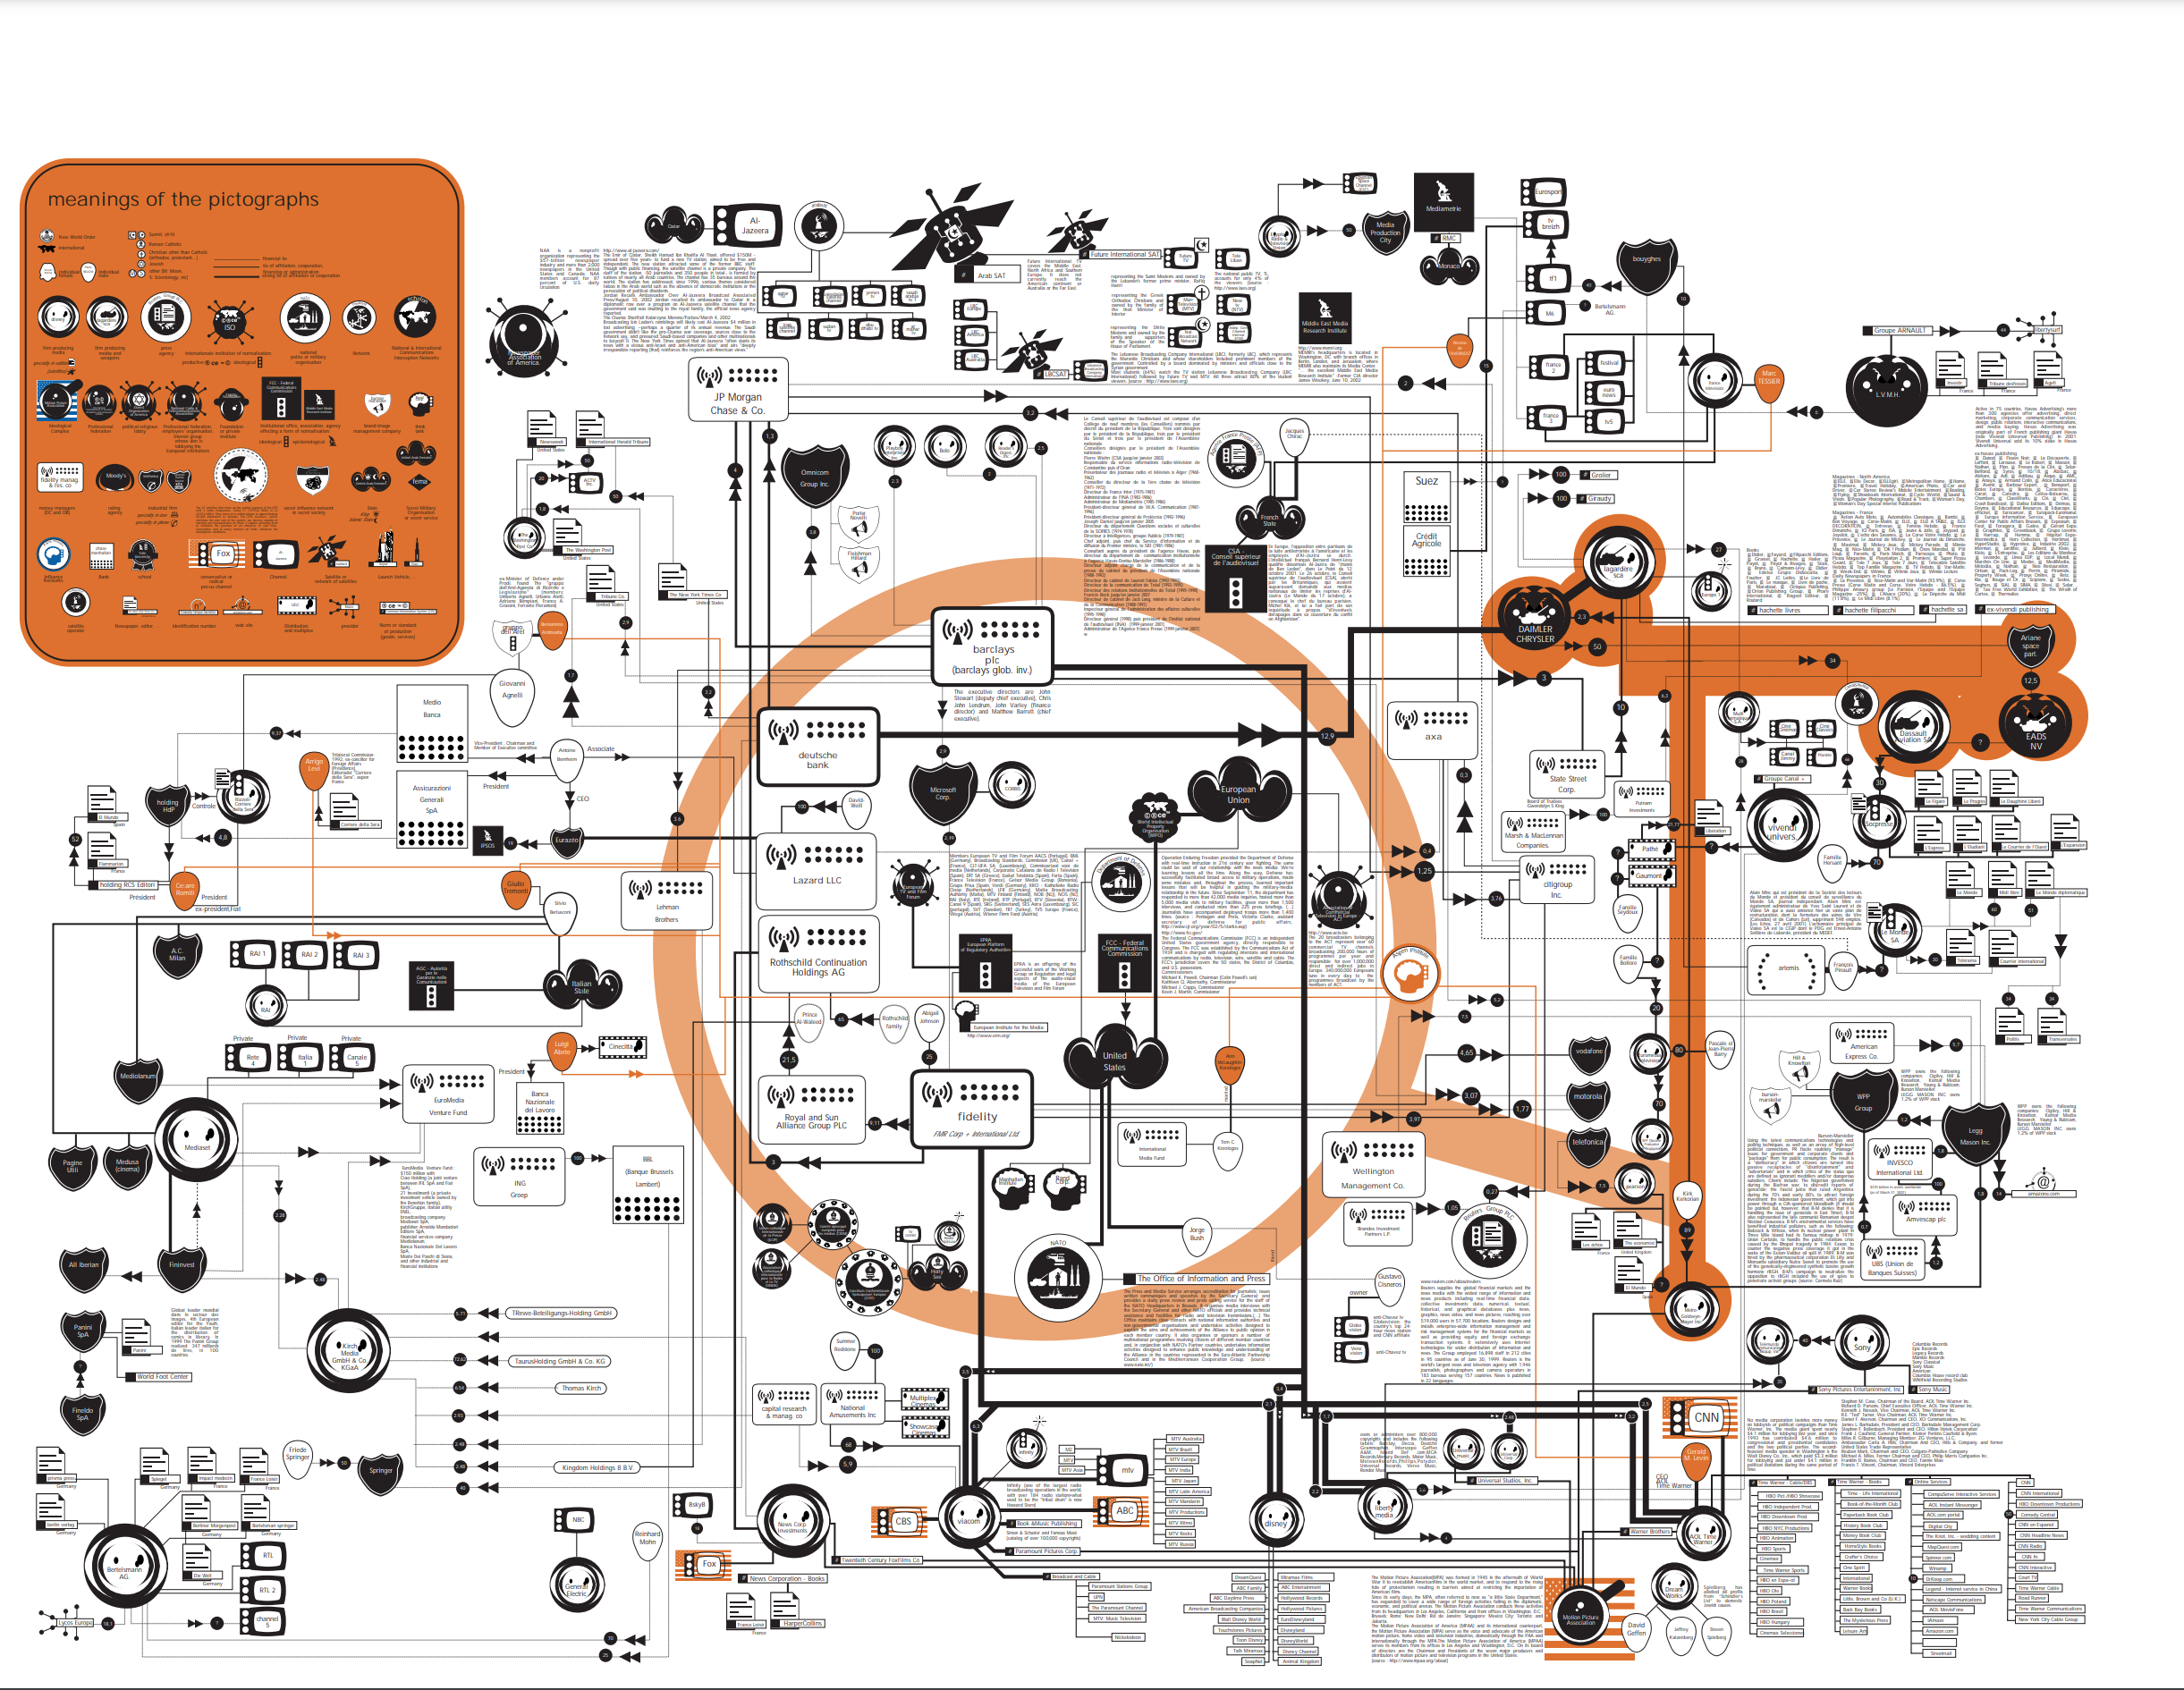
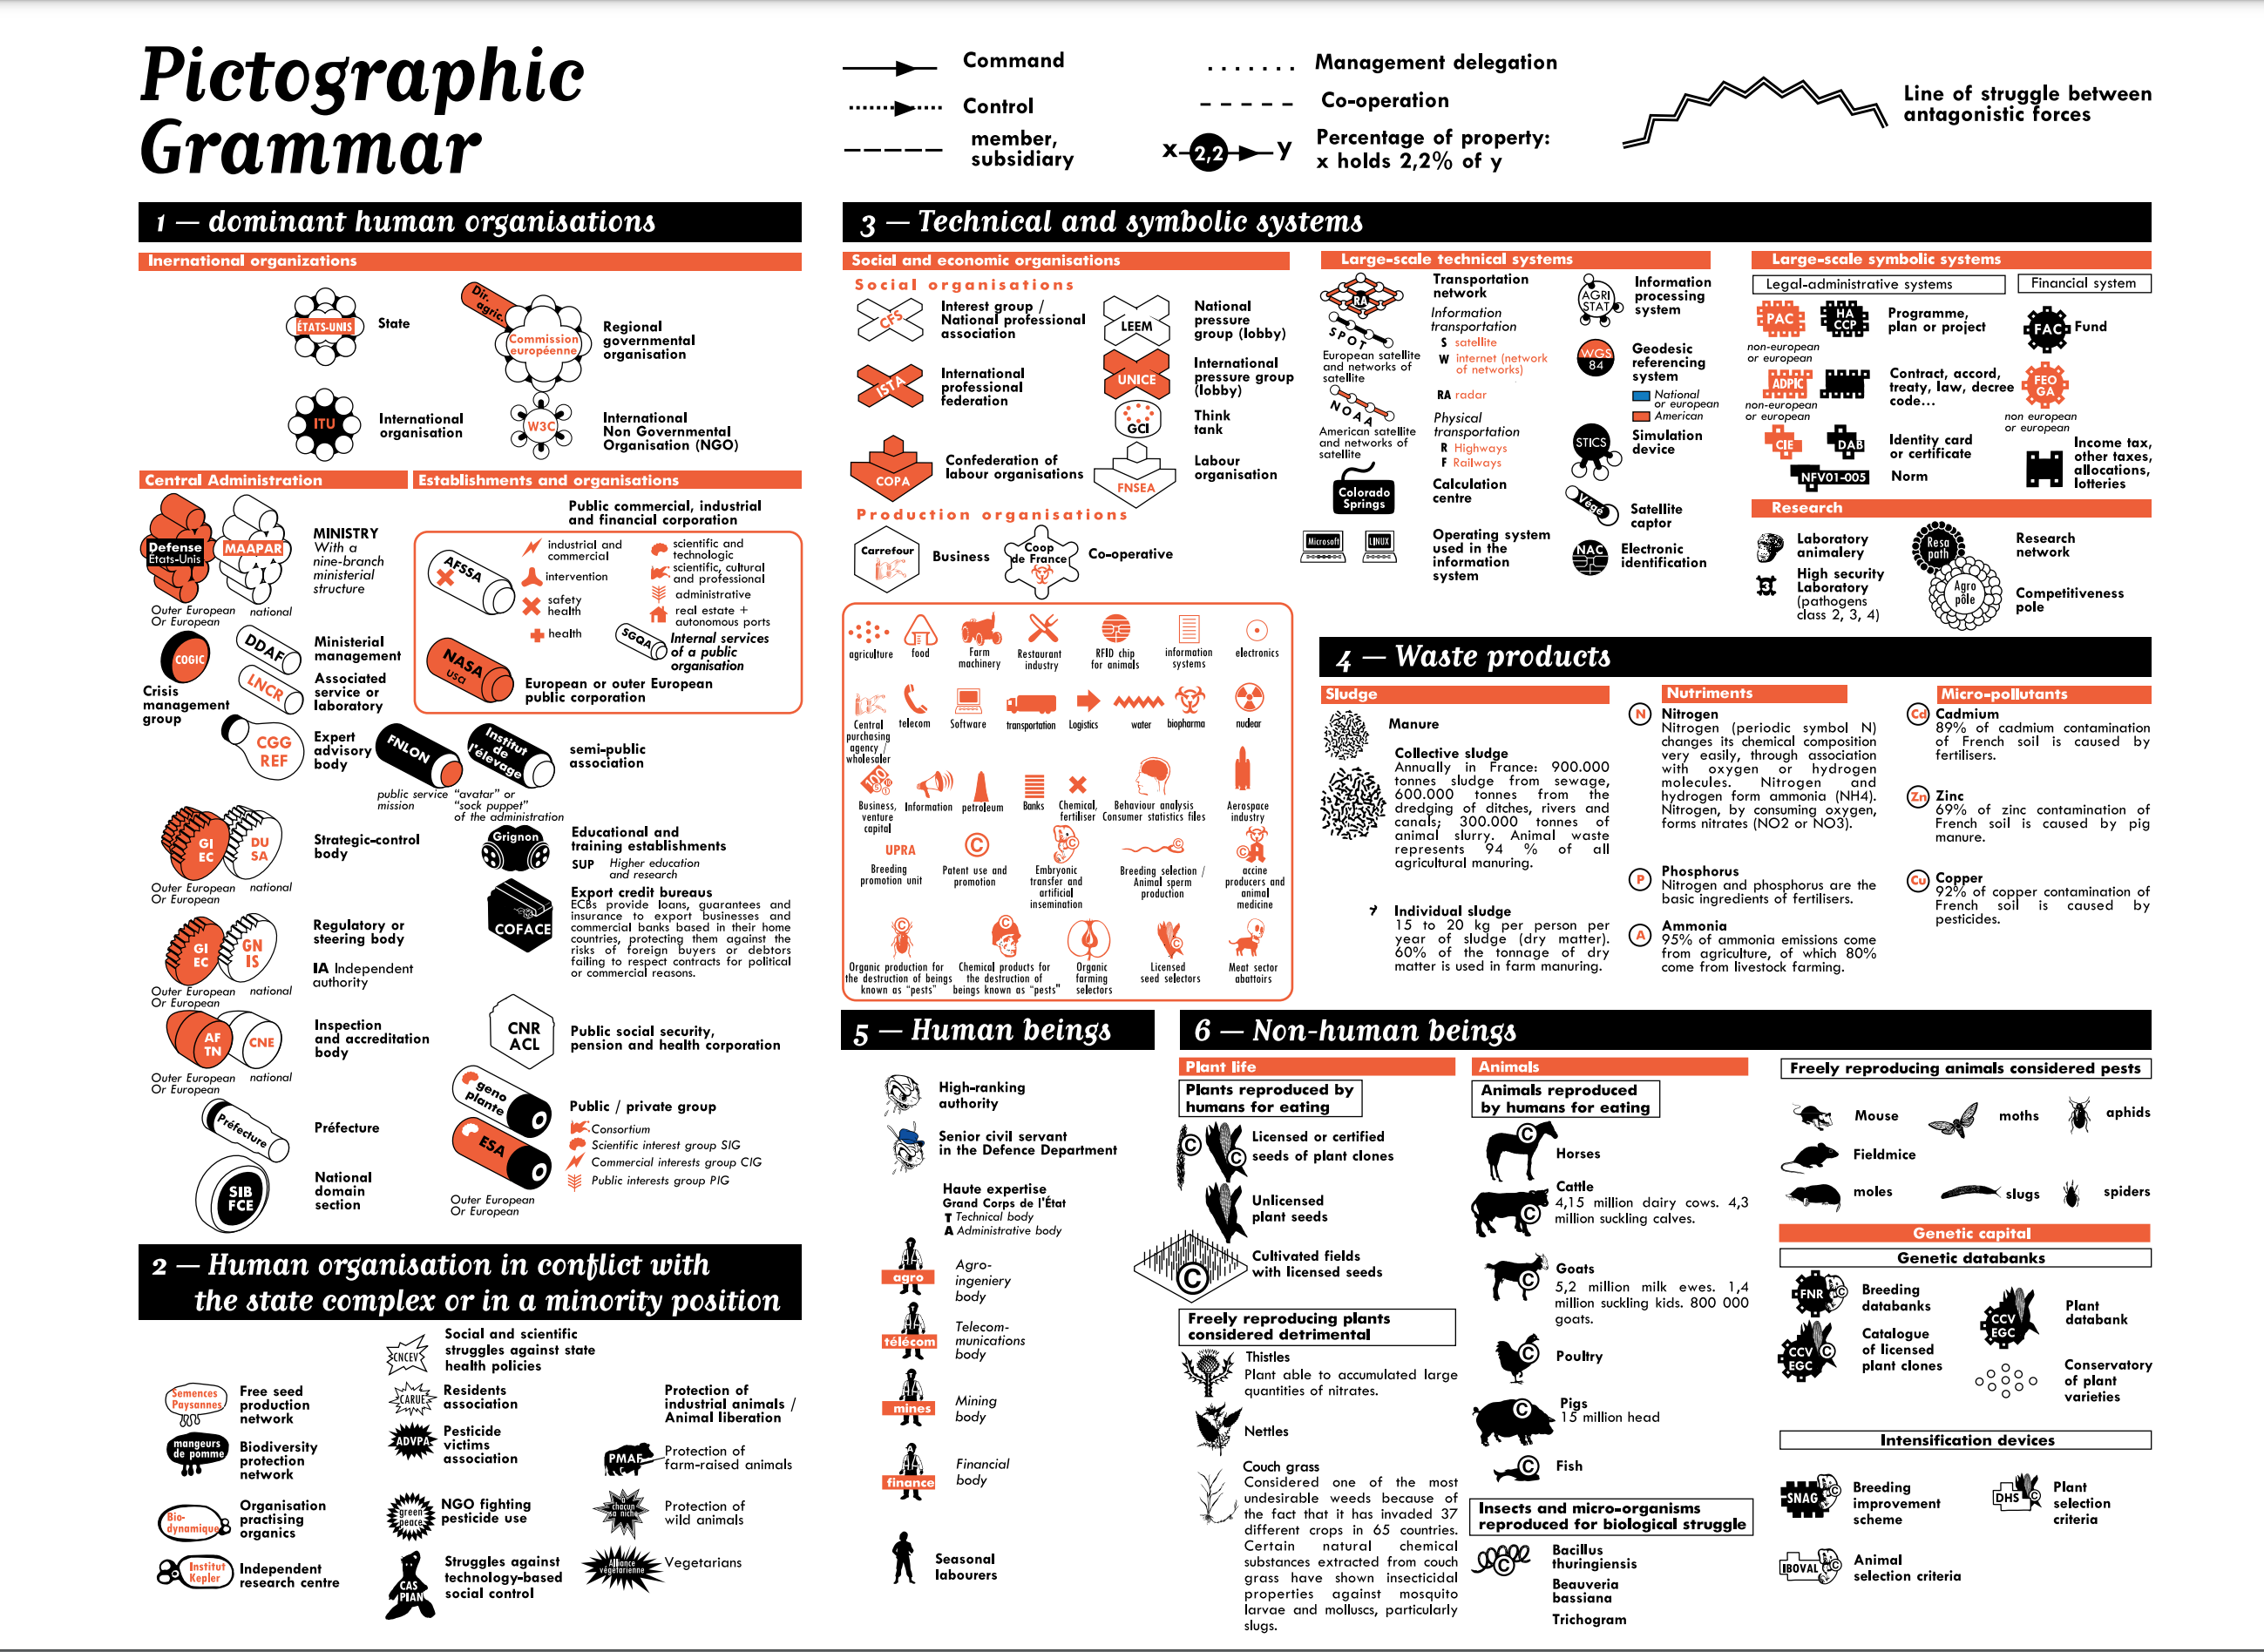
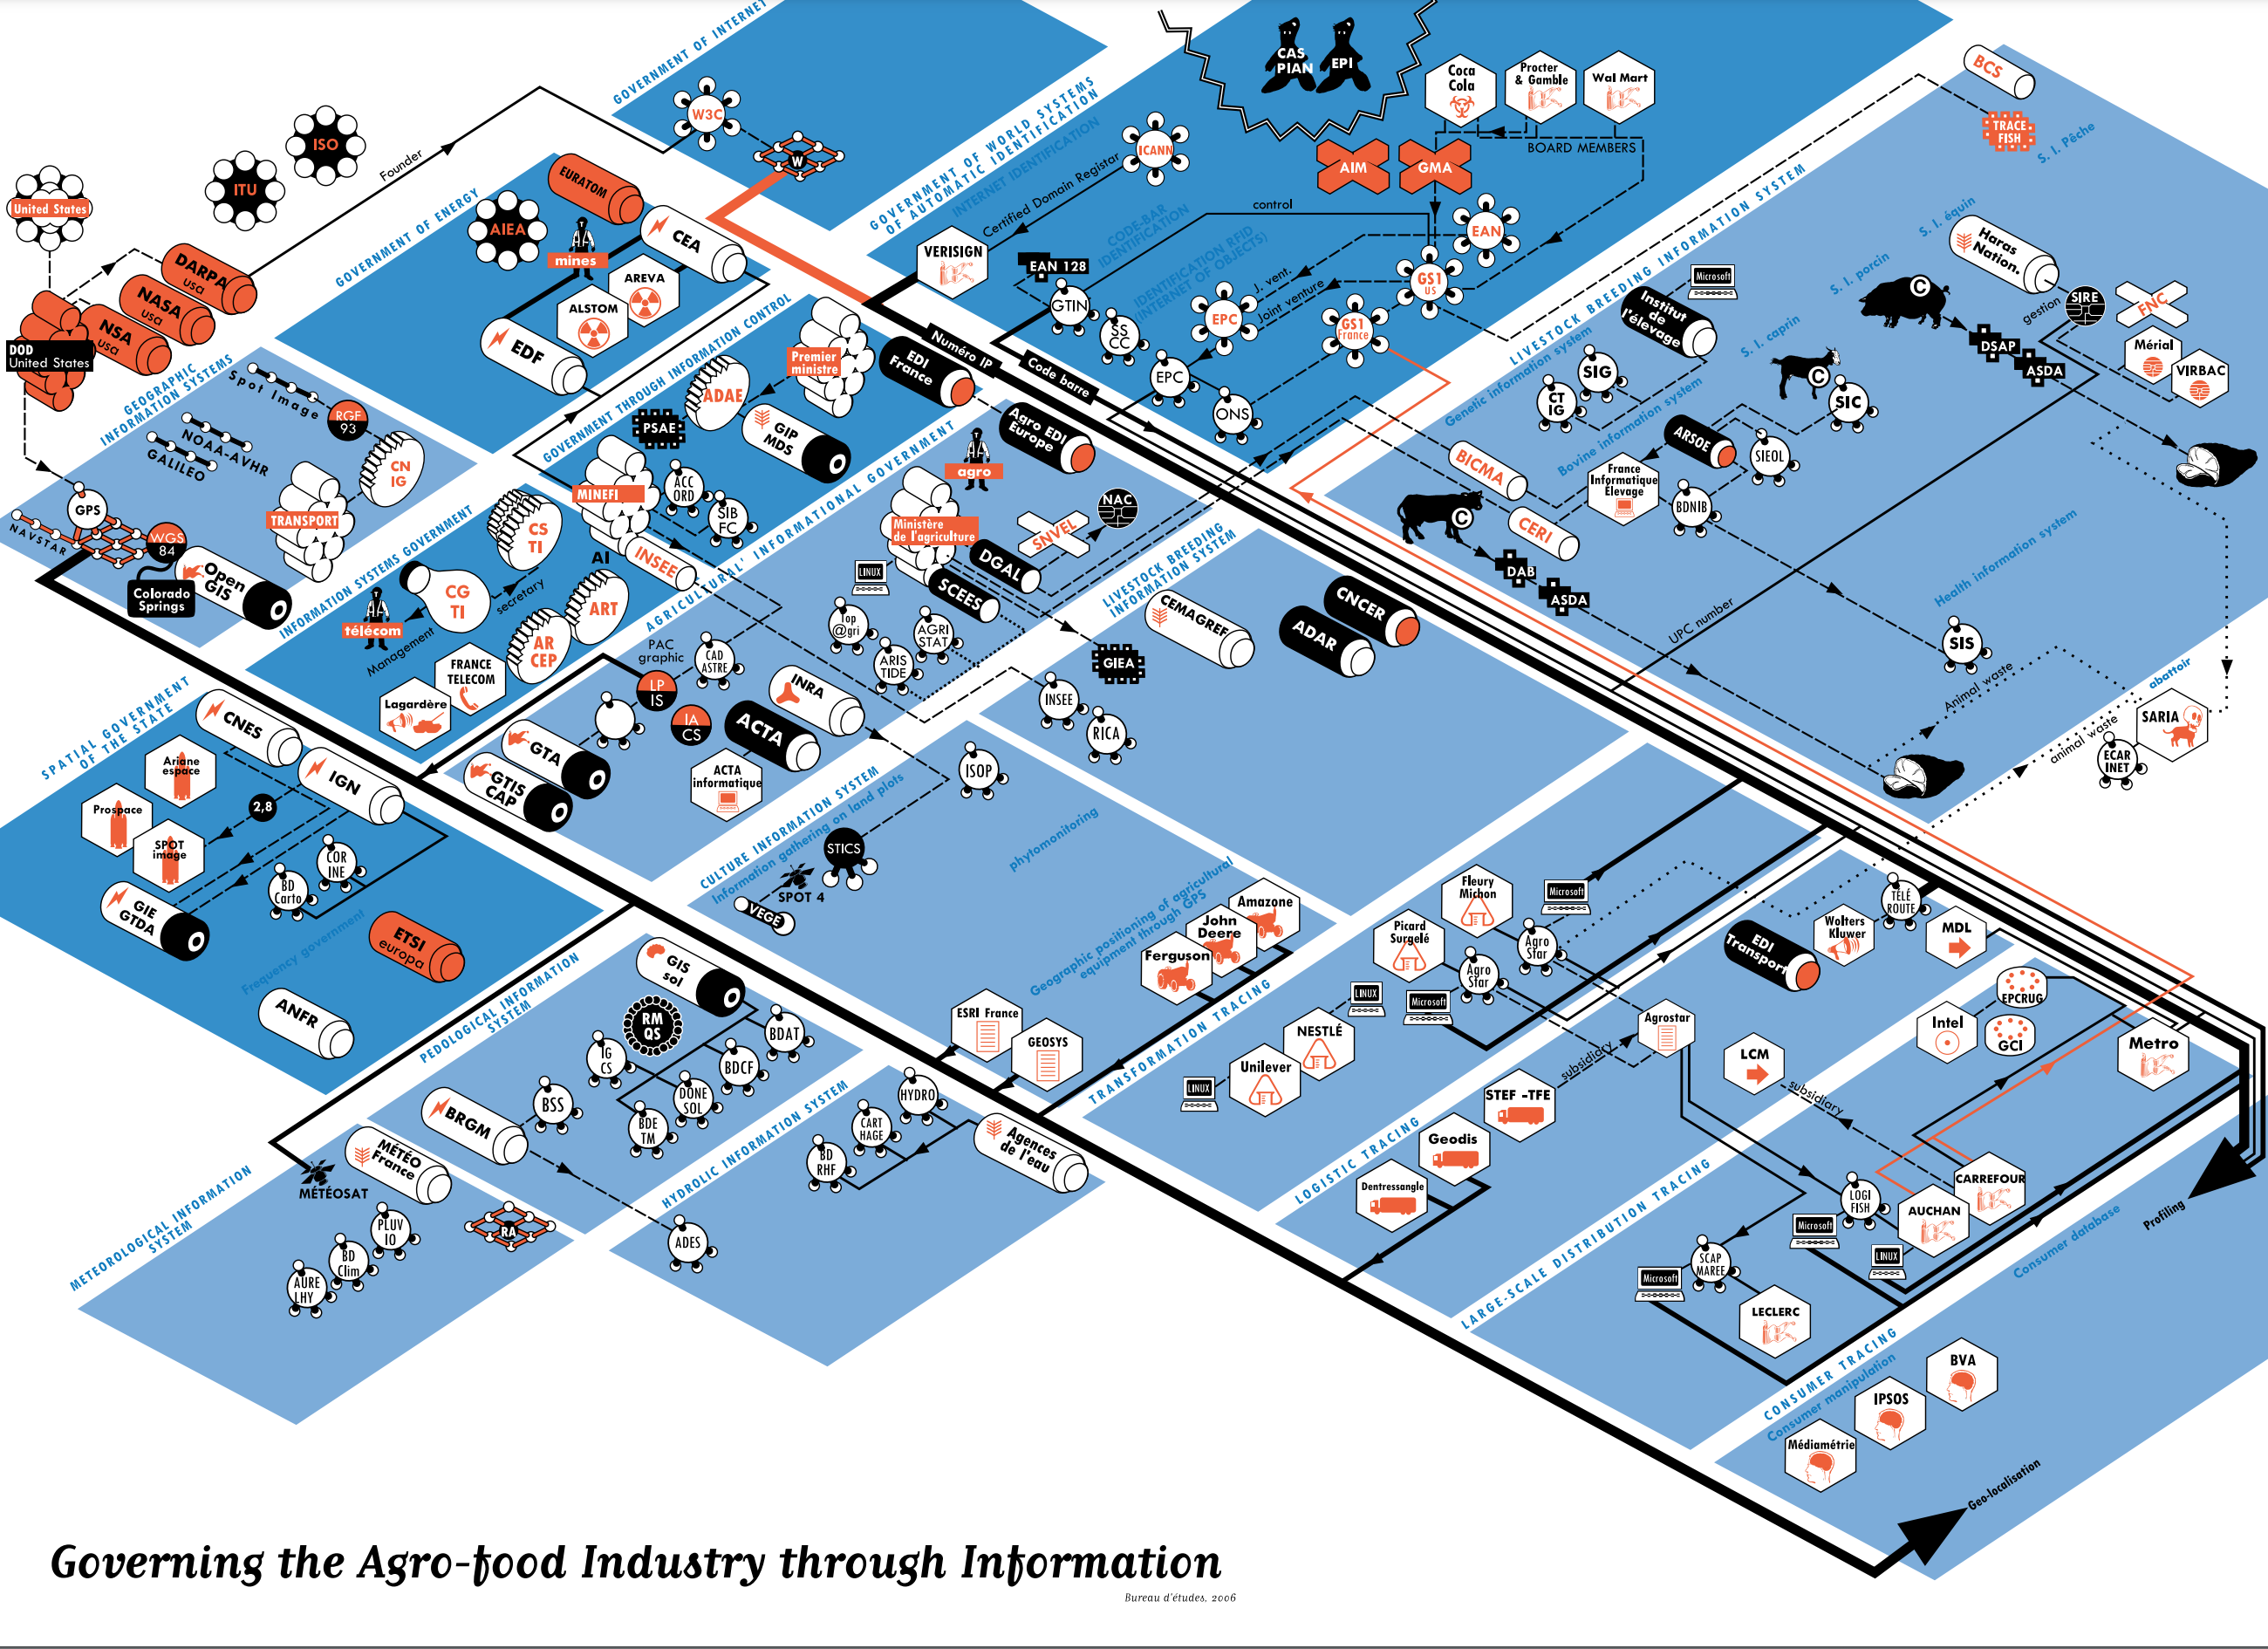
Bureau d’Etudes, 2005-2006: Diagrams of global media control by transnational corporations and state actors (top); diagrams from maps of Agro-Food Industry power, including “pictographic grammar.”
We can see all these legacies at work in contemporary attempts to diagram how systems work across increasingly indistinguishable social and natural spaces, like Kate Crawford and Vladan Joler’s Anatomy of an AI project.
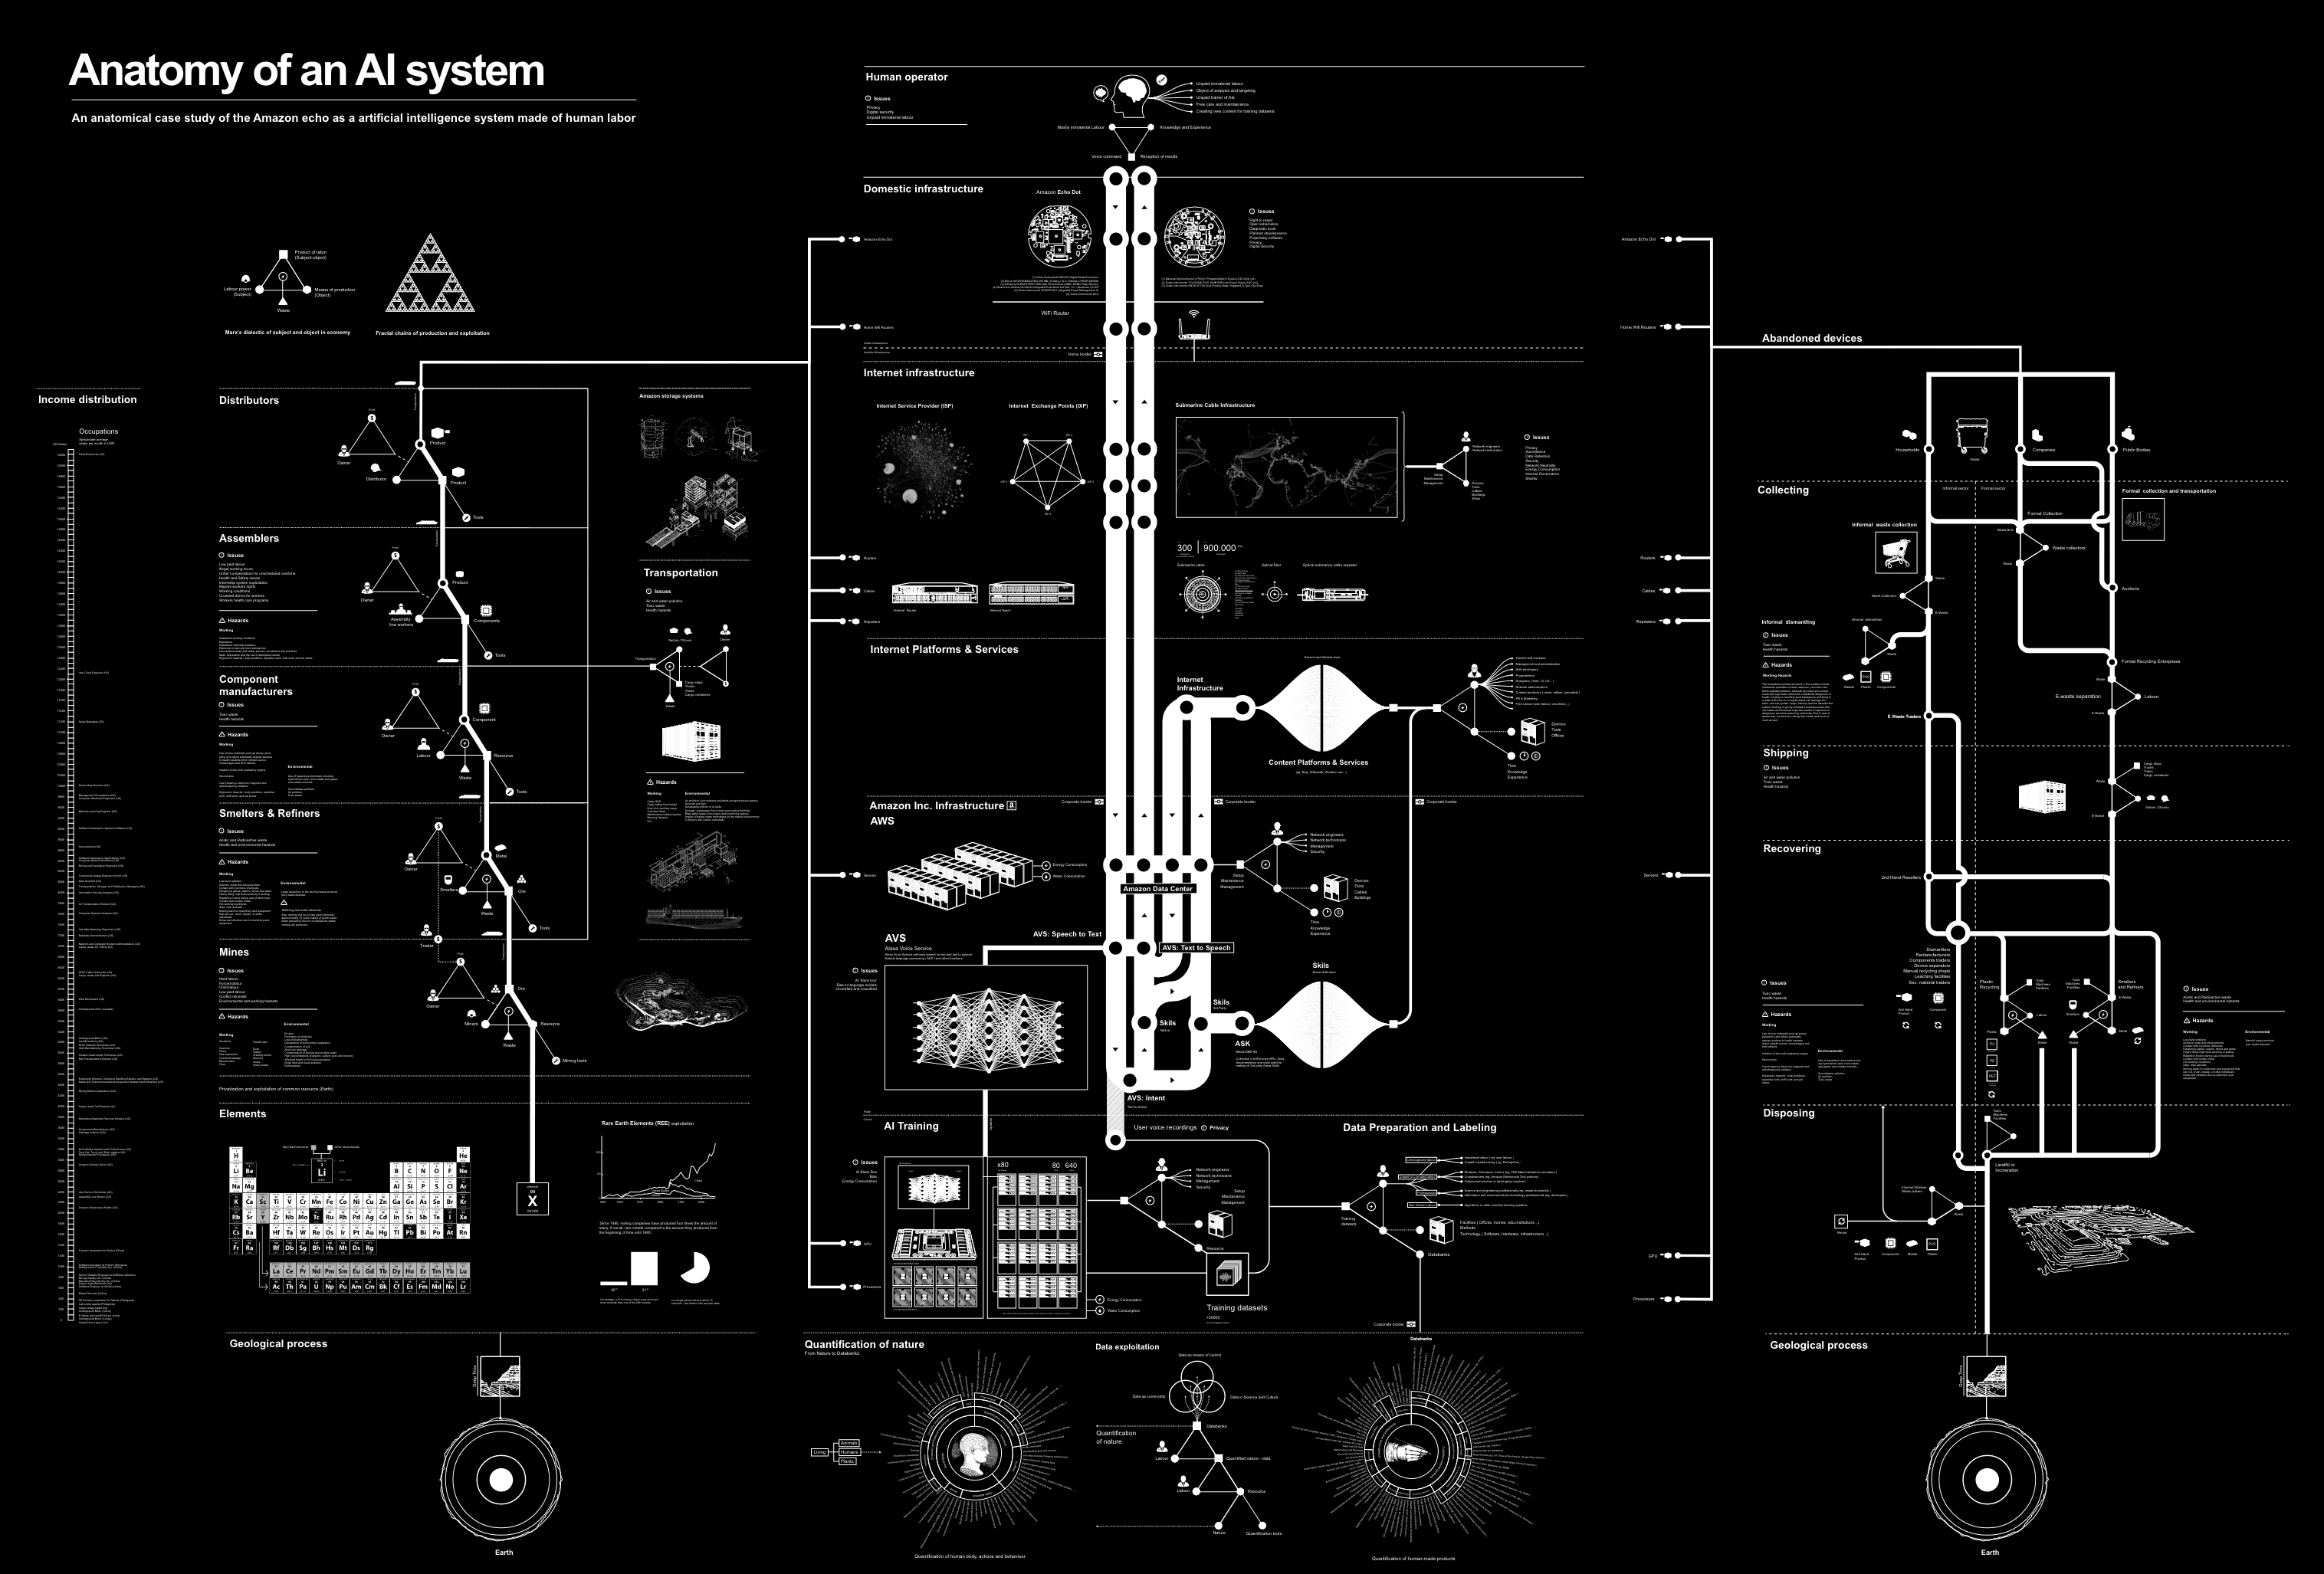
This “anatomy” takes the form of a systems diagram of intricate detail and idiosyncratic uses of diagrammatic convention from across the examples above. For instance, they develop their own symbolic grammar to represent elements of the labor process from a Marxian perspective (labor power, products/commodities, the means of production, and waste).


L: Symbolic grammar; R: a selection of drawing styles and linework, from https://anatomyof.ai/
They deploy different drawing styles (realistic wireframes, maps, cross-sections, a periodic table, geometric diagrams) to capture the heterogeneity of the parts of the system while using a variety of linework styles and widths to represent different kinds of connections between those parts. Finally, they organize it compositionally such that reading from left to right follows an expanded “lifecycle” of the particular artifact they’re interested in mapping, the Amazon Echo Dot, from mineral extraction and logistical distribution to internet infrastructure through to abandonment and disposal. In each of these last three examples, we see a mode of tracing and annotating systems not as maps of energy, information, population, or material flows, but of power and its operations.